How Videos Goes Viral: the role of audience networks
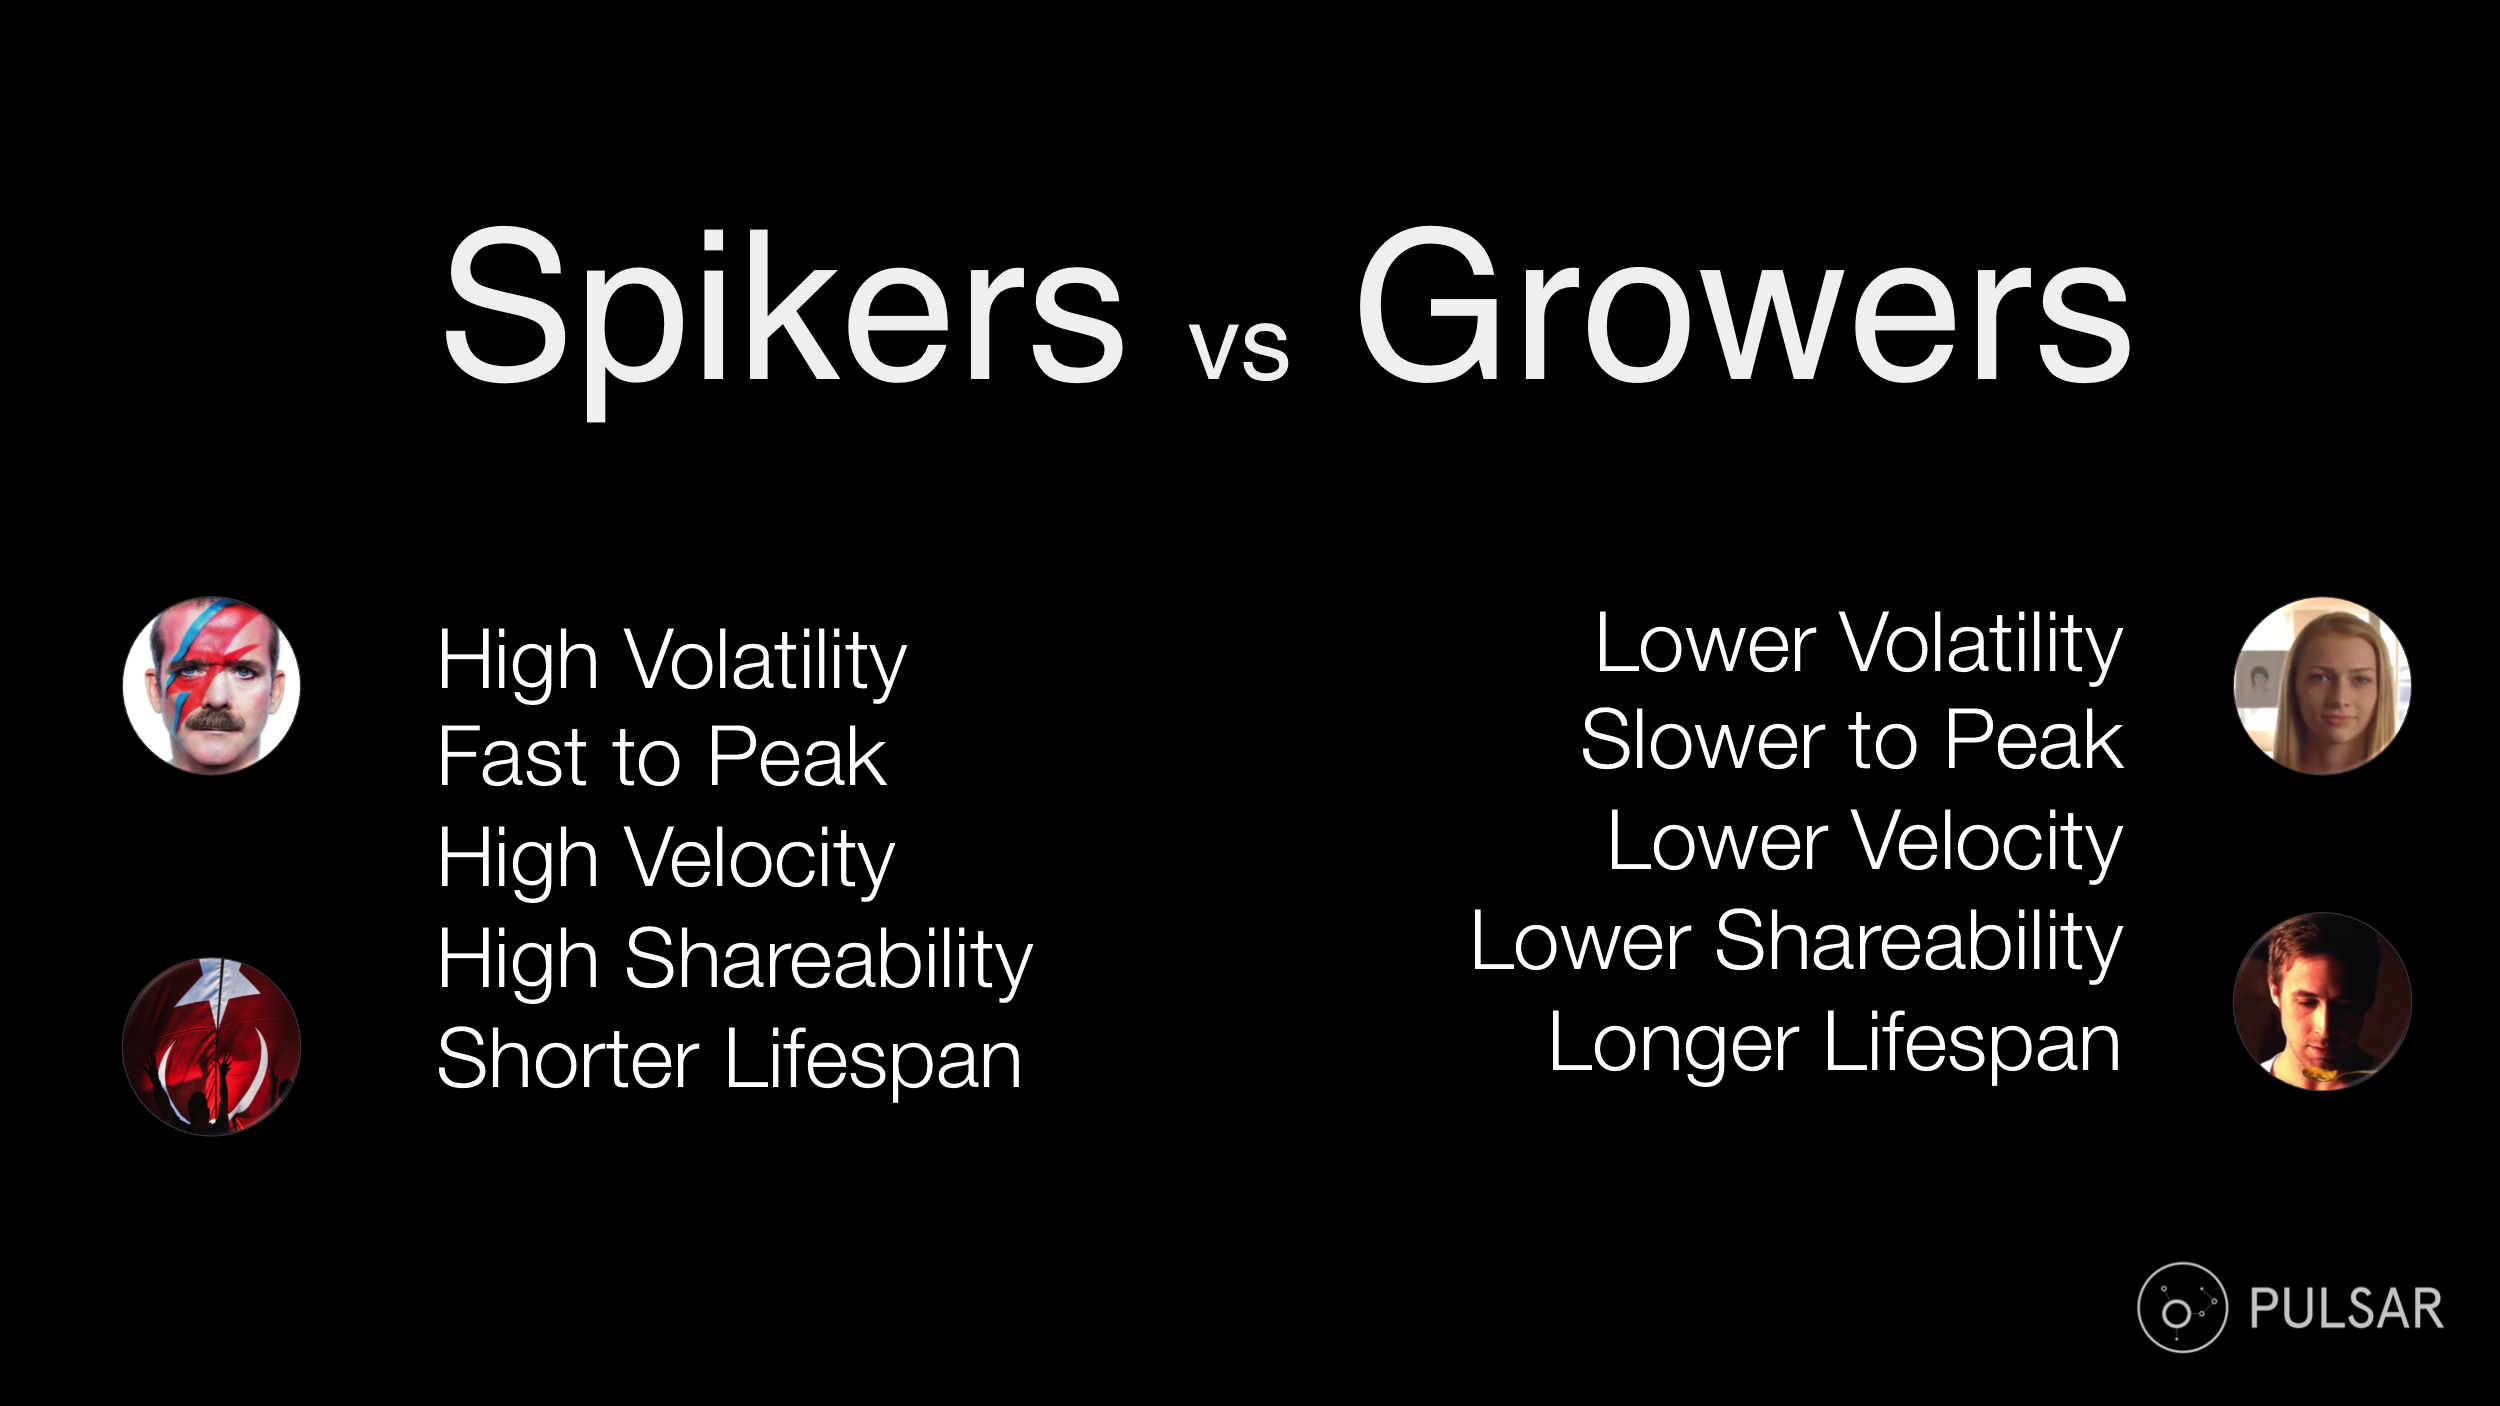
In the first part of this blog series, we identified 7 traits that describe and quantify virality. Although none of the variables on their own proved able to define how a video goes viral, they correlated into two models of viral diffusion. One model we called “spike” – the sudden ‘explosion’ of sharing activity – and the other we called “growth”, where popularity grows slower and more steadily.
In this blog post, our Chief Innovation Officer and VP Product Francesco D'Orazio looks, using social network analysis, at how the audience composition and audience structure influence the way a video spreads and goes viral.
How videos go viral
What makes a viral video spread in one or other of these ways? Most studies on the subject focus on virality as a feature of the content. But what if virality is (also) a feature of the audience? Can the demographics and the structure of the audience for a video explain how it goes viral?
We are studying 4 videos:
- Commander Hadfield’s cover of Bowie’s ‘Space Oddity’, on board the International Space Station
- Dove’s Real Beauty Sketches, to understand how brand & advertising content spreads
- Ryan Gosling Won’t Eat His Cereal series of Vine videos, for serialized narrative mobile content
- A grass-roots video of June’s protests in Izmir, Turkey, for an international and news dimension
In this blog post, we will show how we analyzed the demographics and social network properties of each video’s audience to understand better how they spread.
Read on for some of our best network graphs yet and most fascinating findings…
Metric #1: Amplification and influence
The first thing we looked at is Amplification. Amplification is a measure of the average “visibility” of the tweets carrying the meme. Tweets with higher visibility imply a more influential status of the author who posted them. Can the influence level of the audience of a meme explain its slower or faster diffusion?
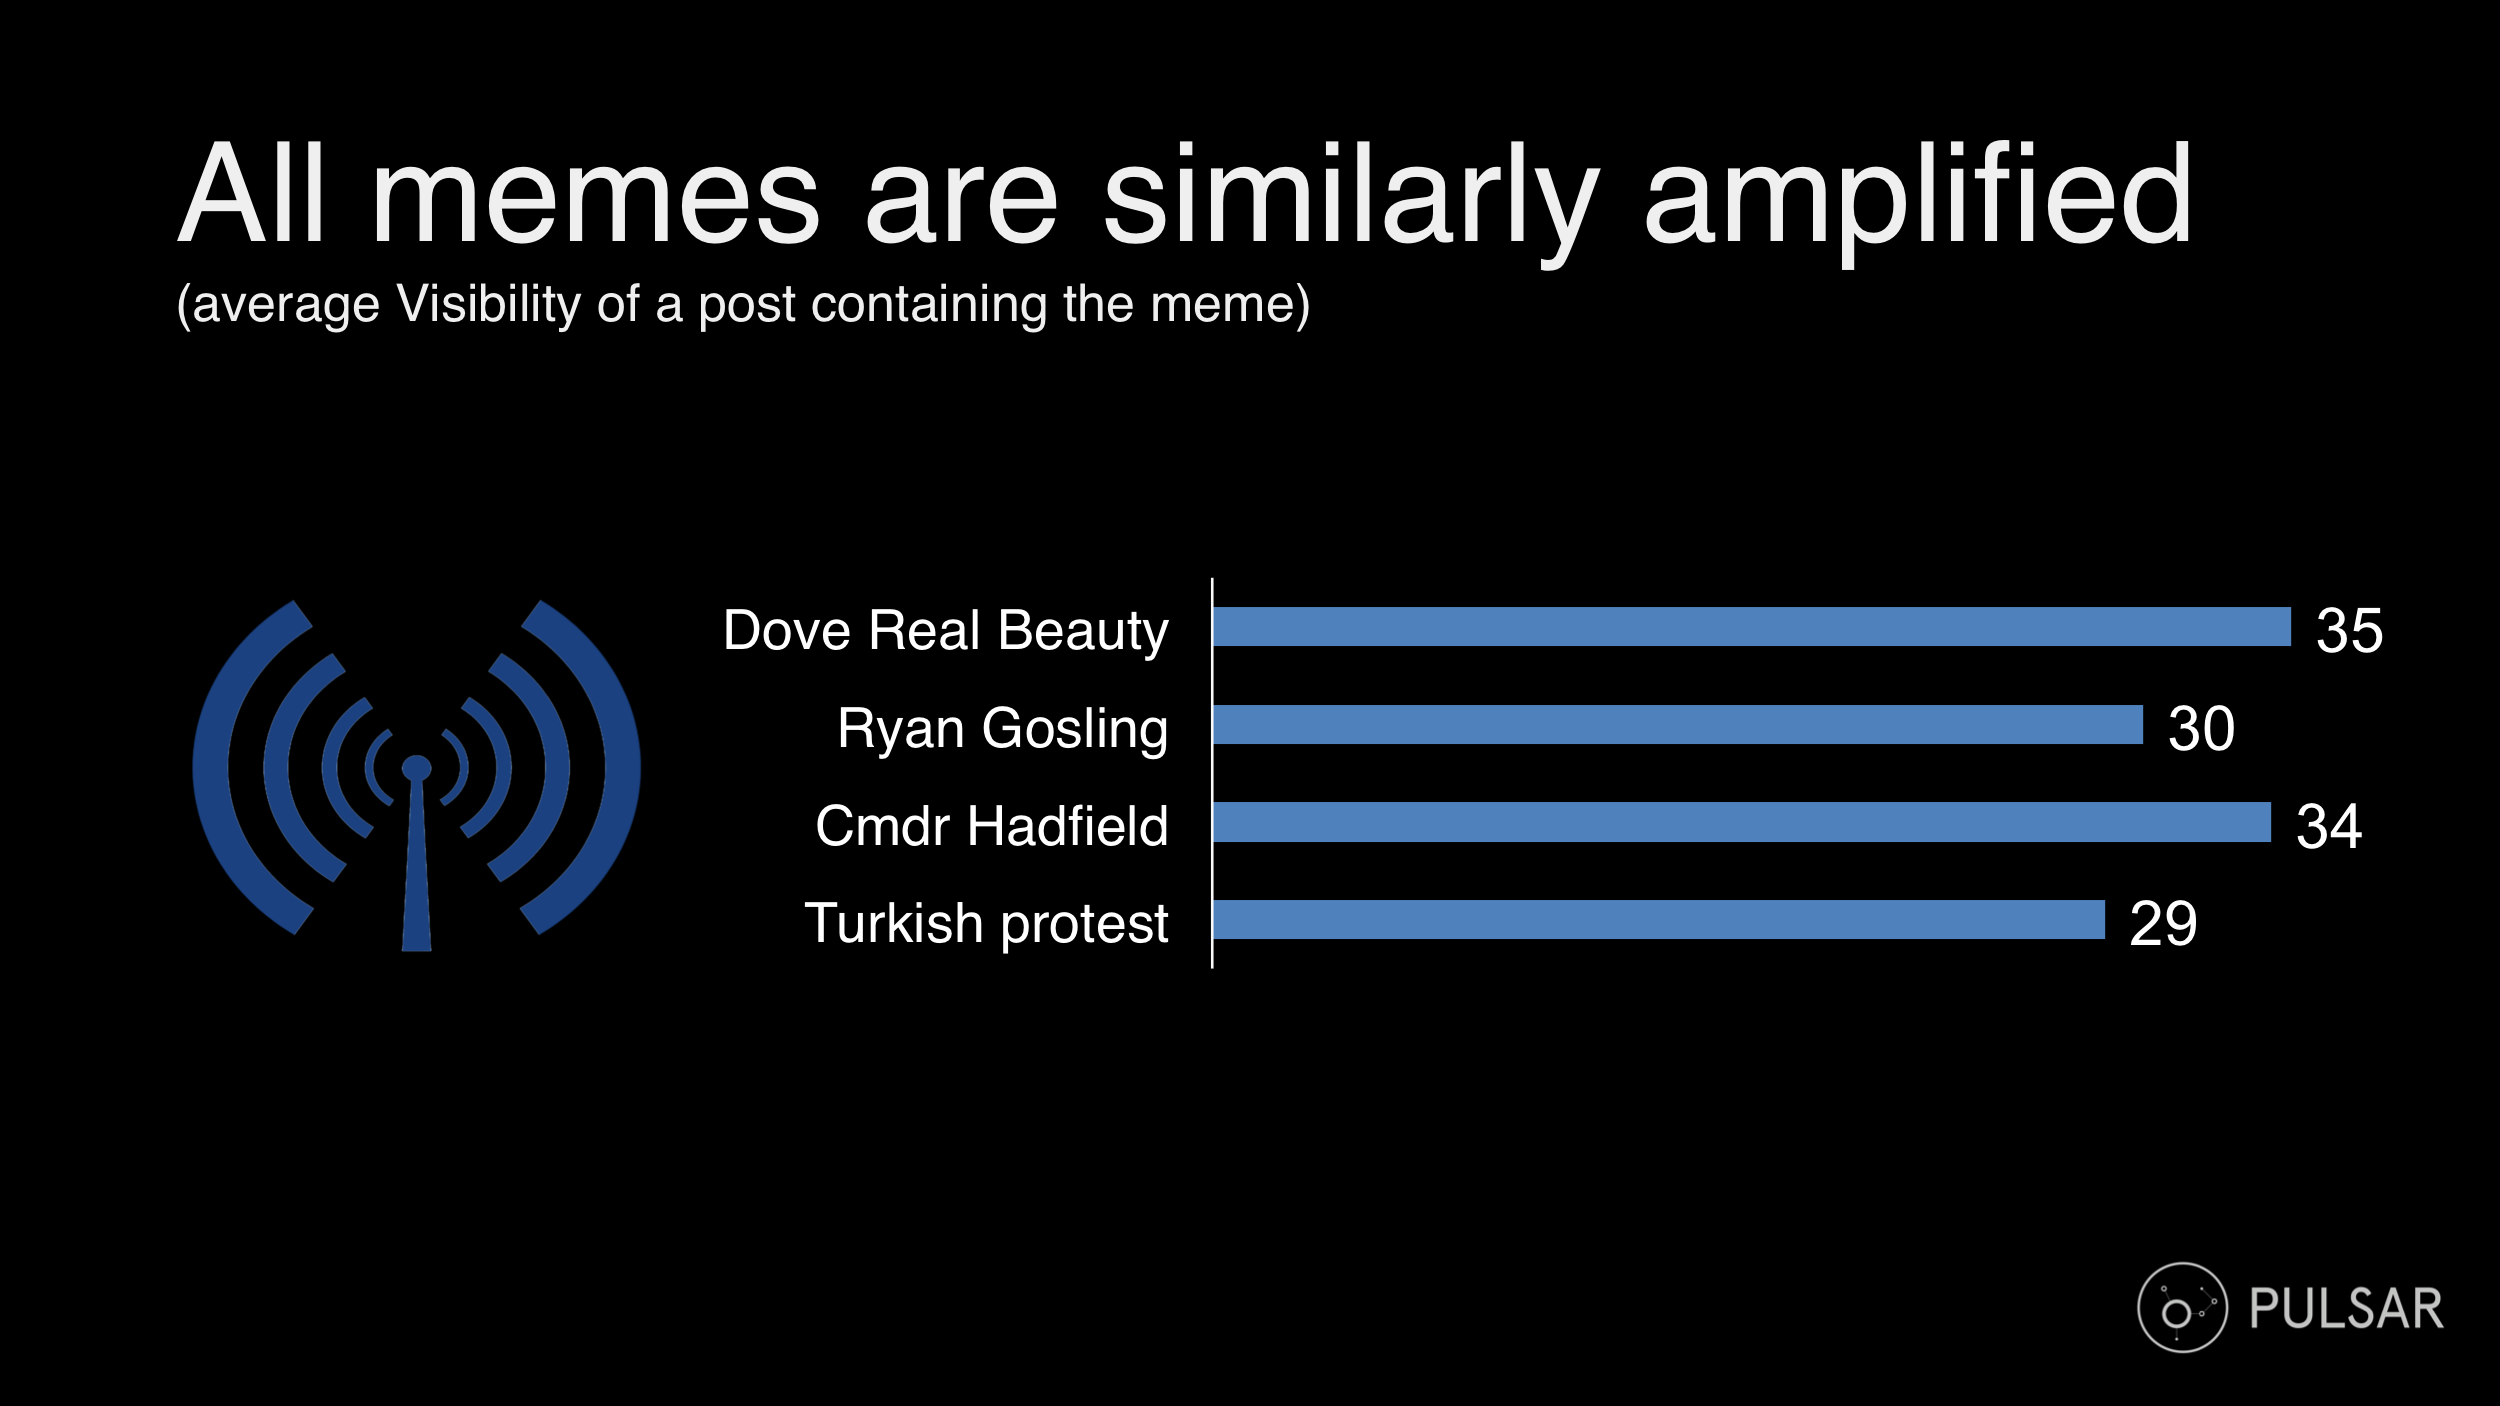
Amplification works similarly across all audiences. It’s fractionally lower for the Turkish protest video and for Ryan Gosling, the first primarily shared in Turkey, the second appealing to a slightly newer (though still very active) Twitter audience. And it’s slightly higher for Dove Real Beauty Sketches and Commander Hadfield. In both cases the variation doesn’t correlate with the virality model of the meme.
Metric #2: How international were the audience?
So the next hypothesis to explain the velocity of the memes was the geographic distribution of the audience. We quantified this as Globality: the percentage of meme shares coming from countries other than the main country. So does the “international-ness” of a video affect its virality? Does a more global or a more local meme spread faster?
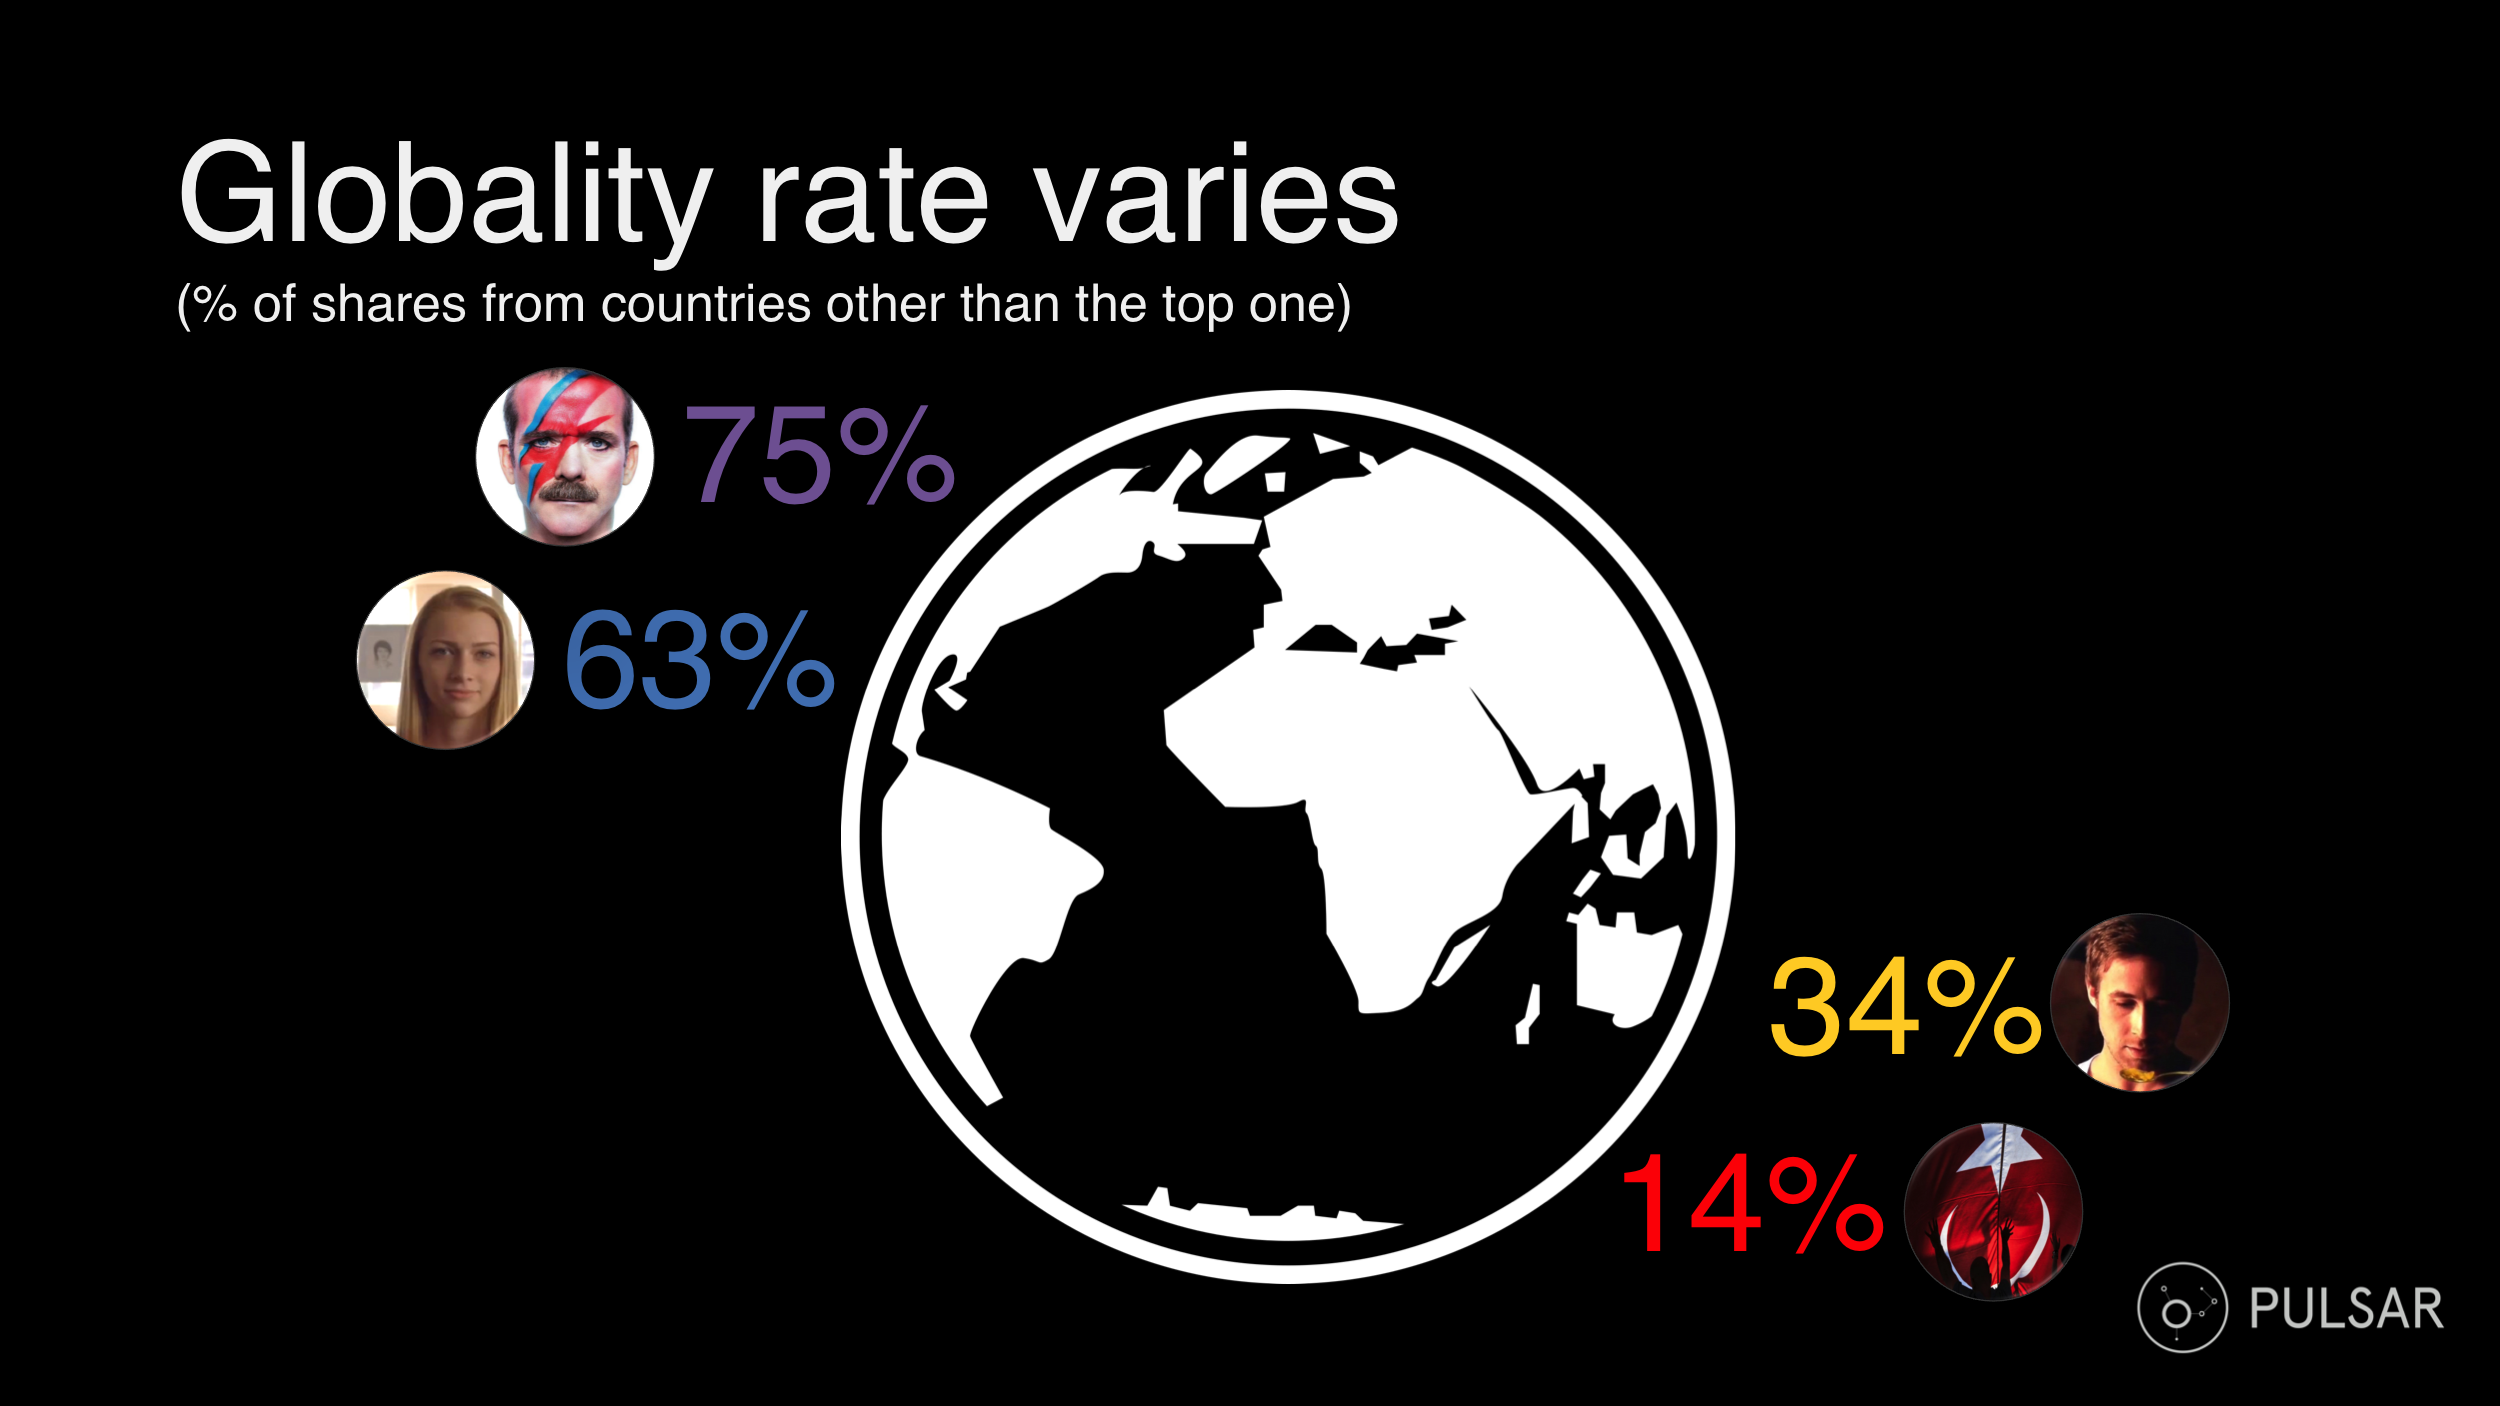
The answer is again, no. The Turkish protest video was “local” but so was Ryan Gosling – and one spread instantly but the other peaked on day 18. Since both Amplification and Globality seemed not to correlate with one or the other model of virality, we then looked at the demographics engaged with each video.
Metric #3: Demographics.
Does the demographics of the audience affect the way content goes viral? Do young, techie male students from global cities push a meme faster than, say, middle aged housewives from rural Germany?
We used Bayesian statistical inference to analyse the demographics of the audience. This method uses the available information on Twitter and matches it to a sample audience interviewed in real life to get known demographics, across the various countries involved in the study. Below is a summary of the most prominent demographics traits of the four audiences:
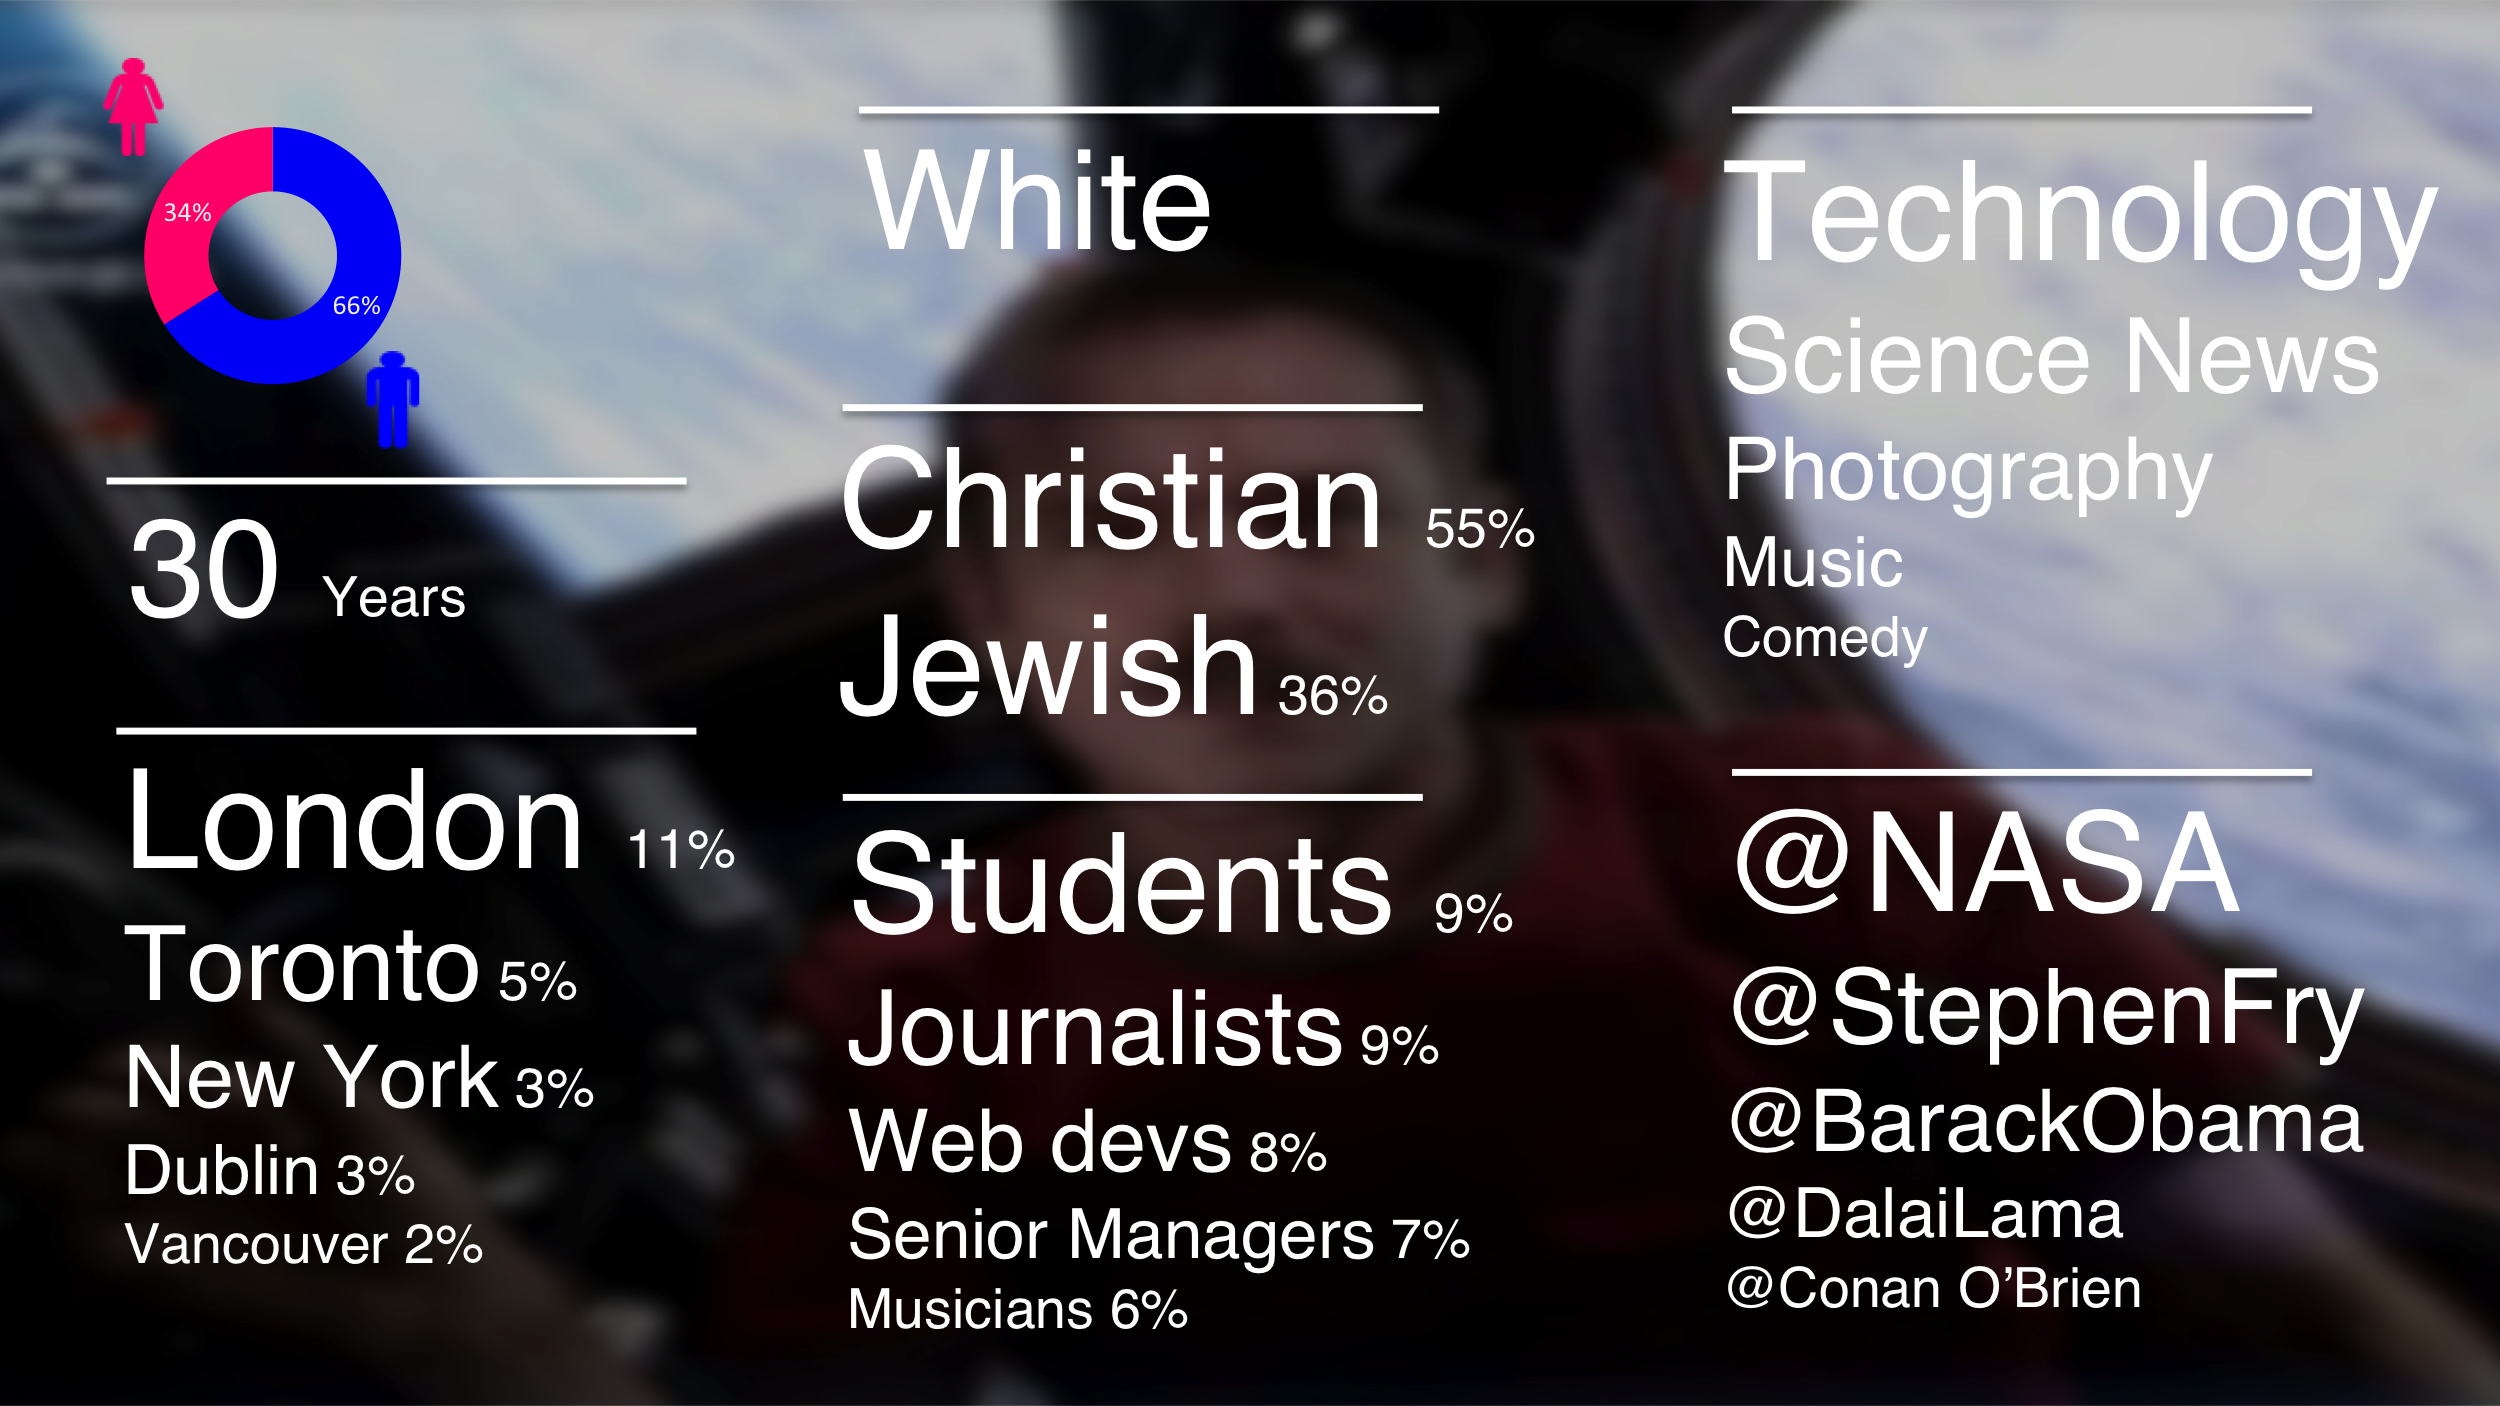
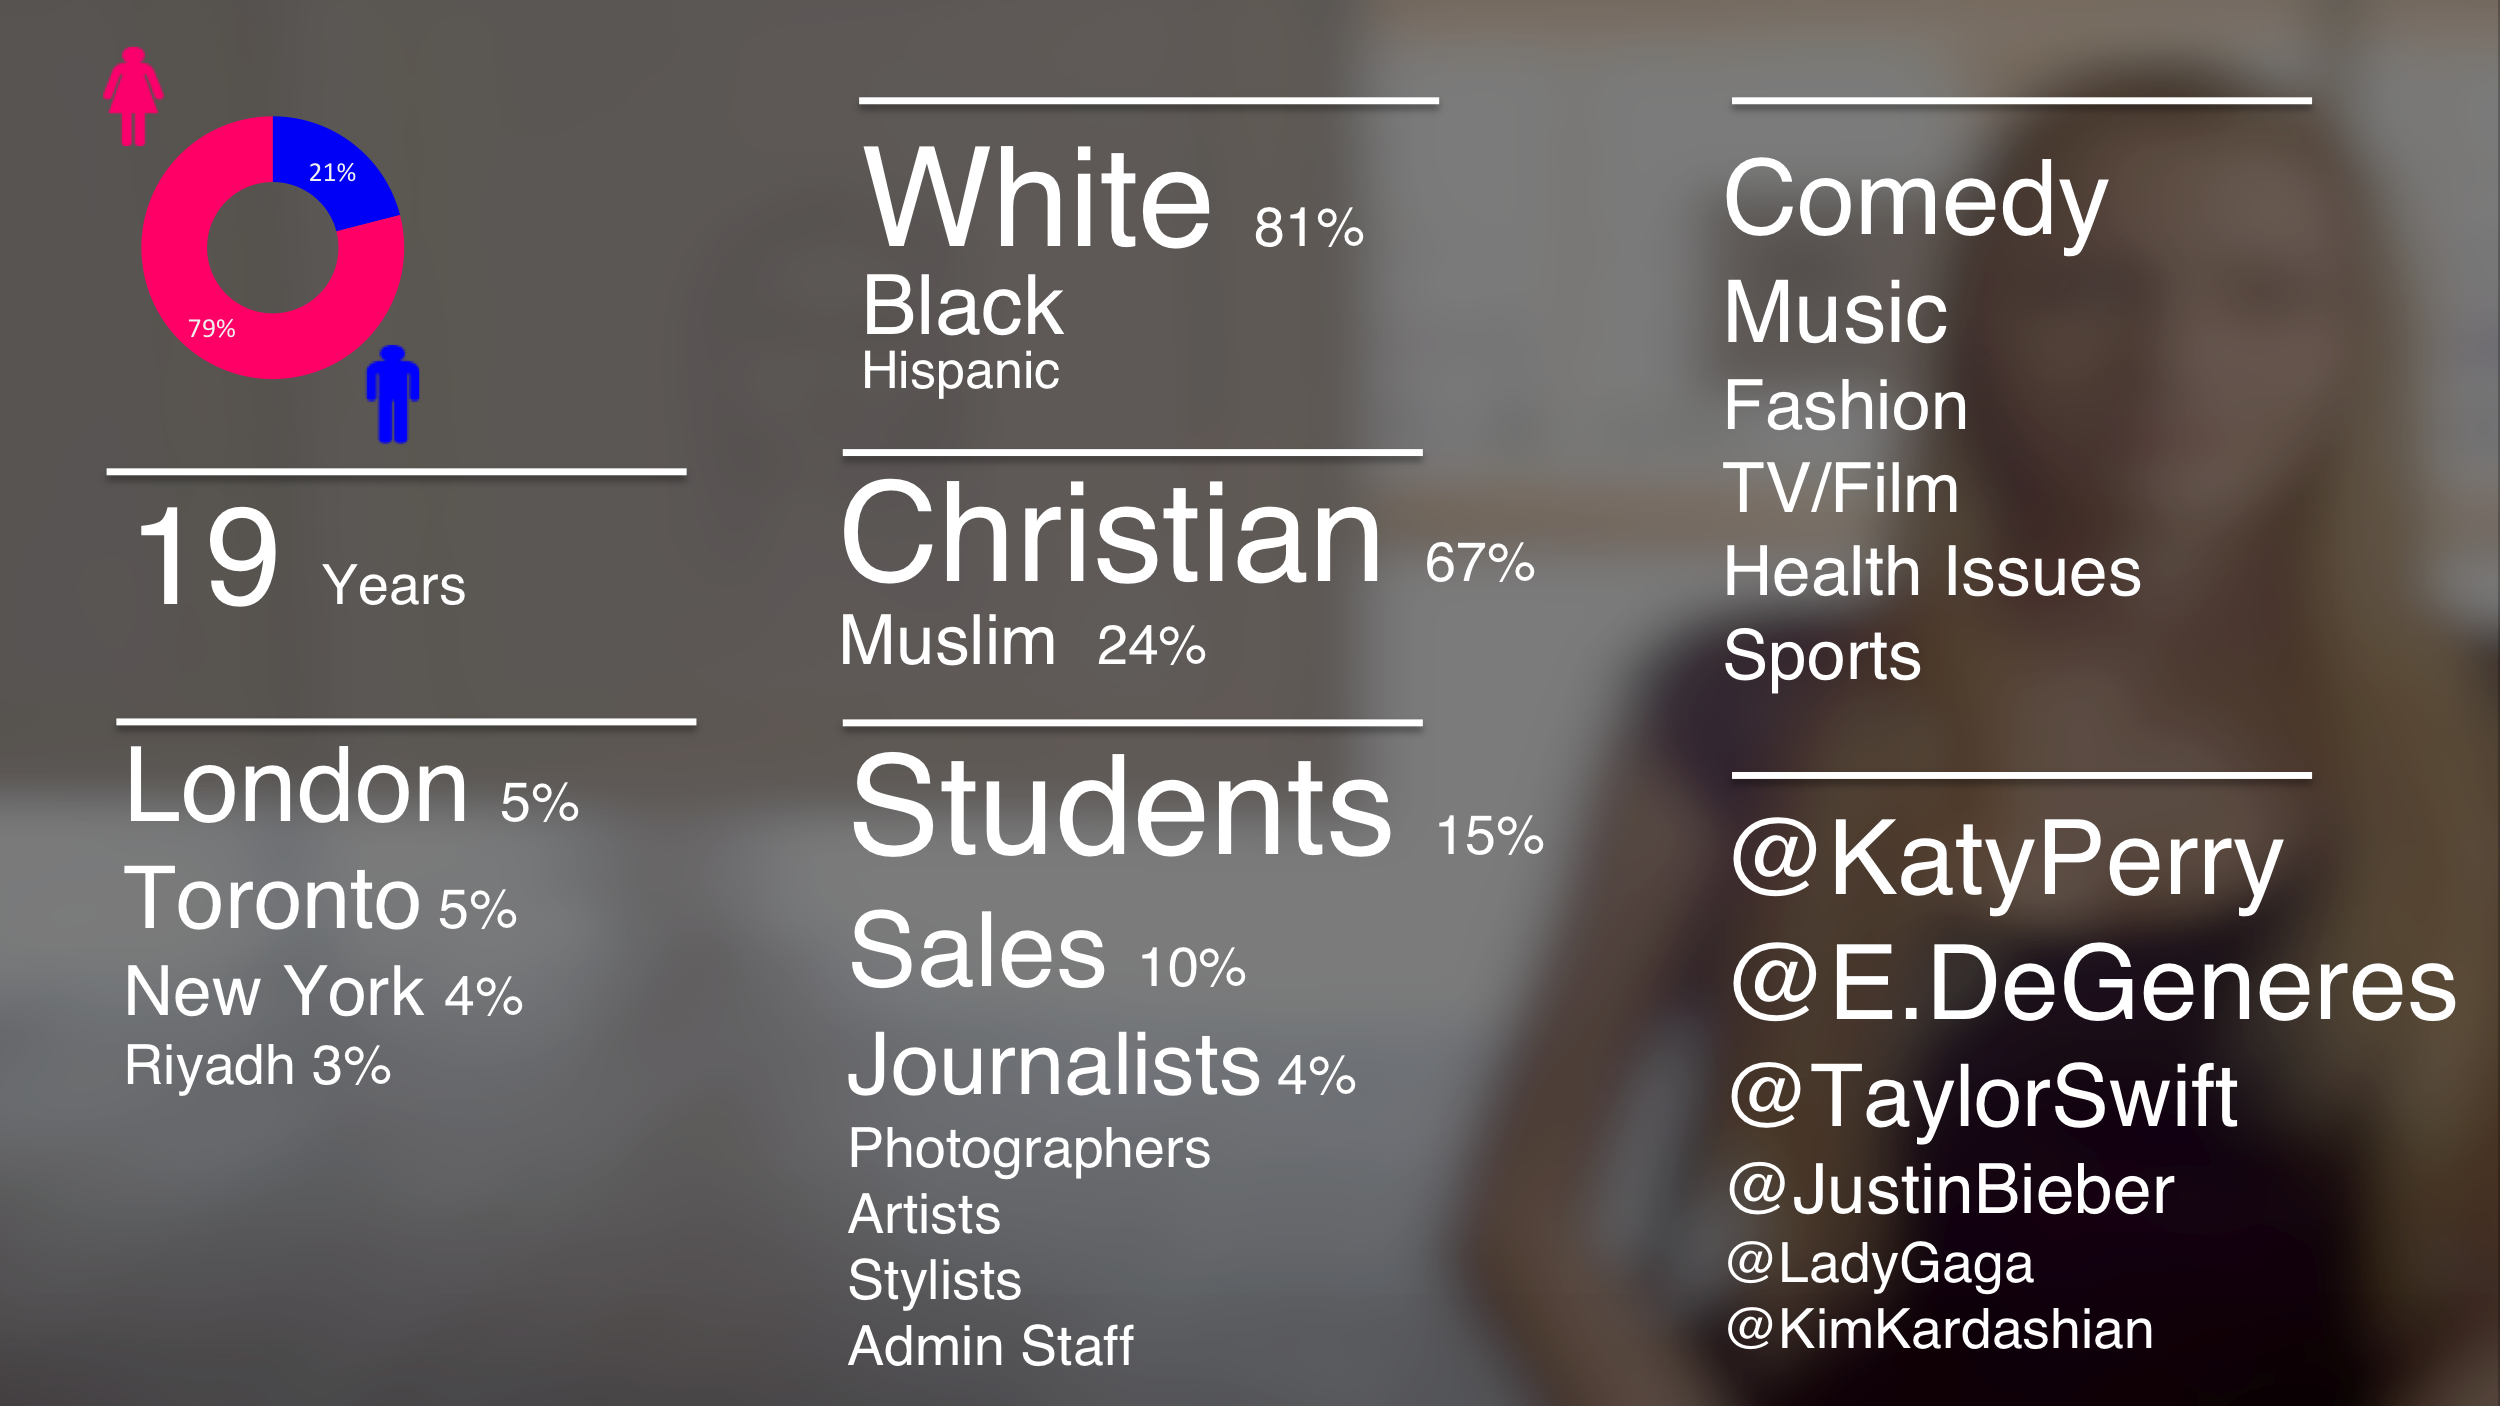
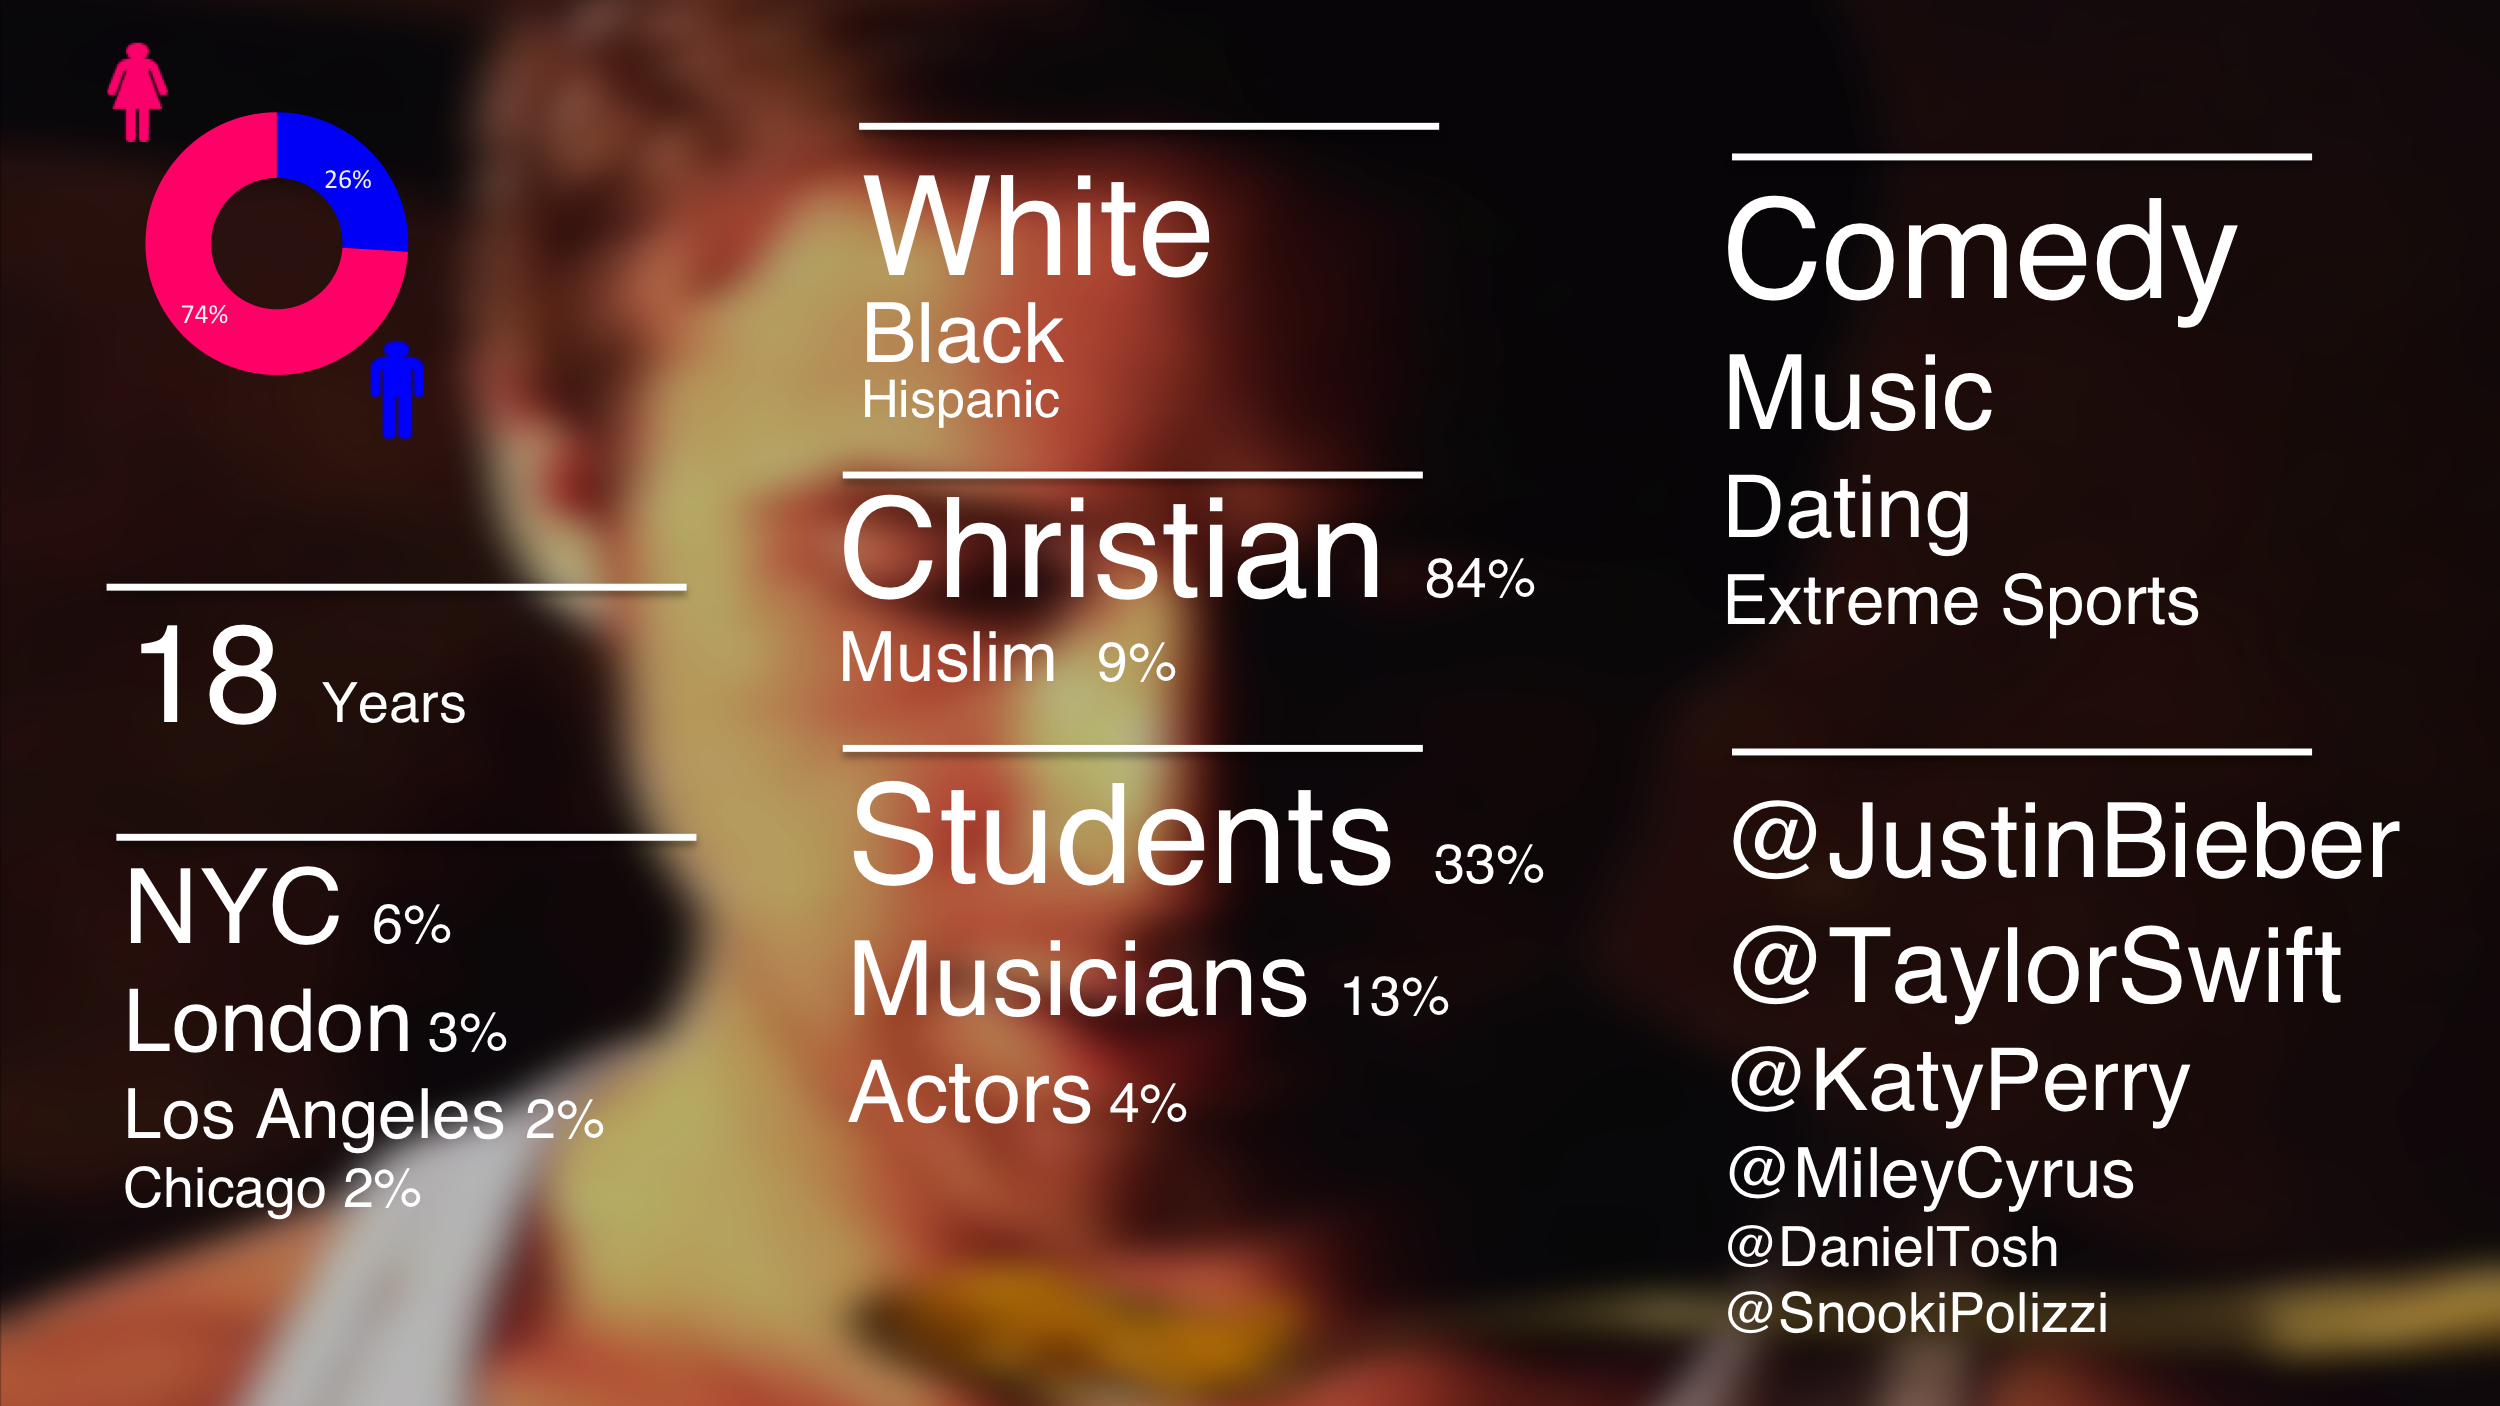
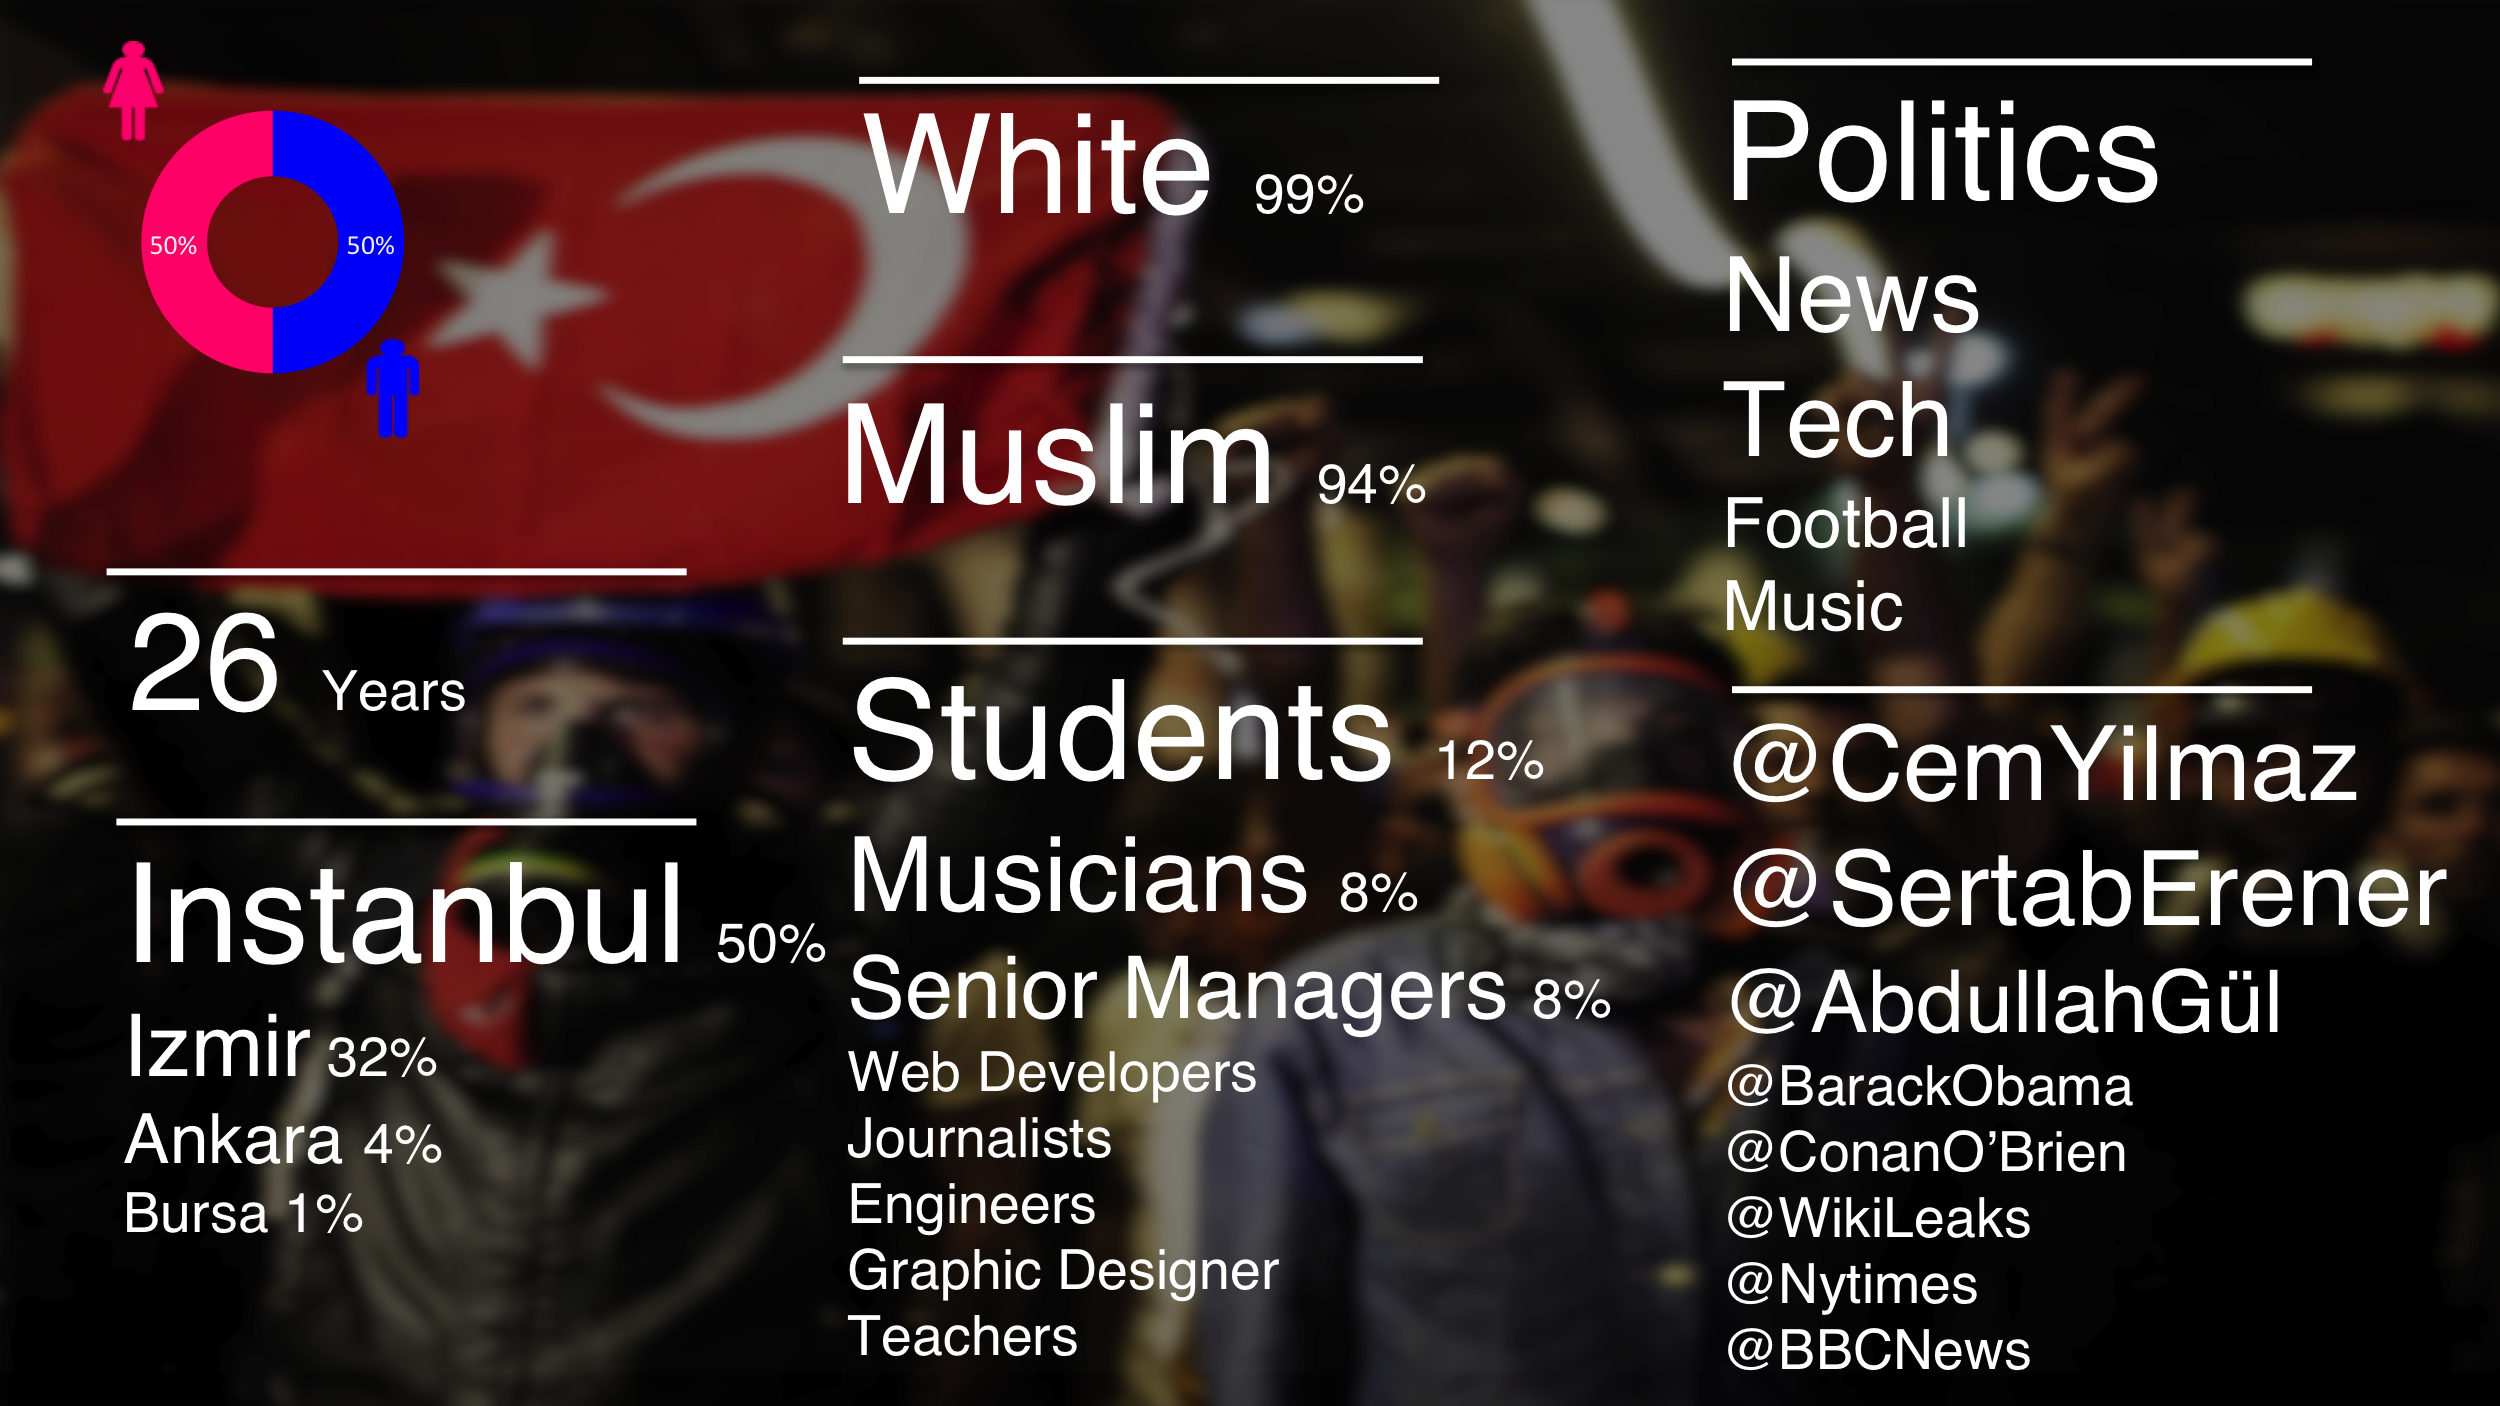
Although students and global cities feature heavily in all audiences, there doesn’t seem to be any direct correlation between virality models and demographic traits. Instead the demographics are completely different for each meme. Not to mention that students represent 33% of the Ryan Gosling audience, the slowest meme of all – so it seems that youth demographic probably isn’t necessarily a critical cause for a video to go viral quick.
And now for some Social Network Analysis…
The audience gets more interesting when you start to look at its social structure. As we couldn’t find any correlation between demographic traits and virality models, we turned to the structure of the audience by mapping the social graph of the people who shared the video.
Your ‘social graph’ is the network of the people you know, and how they’re connected to each other. Because we were studying Twitter sharing of videos, we had easy access to this data through two variables: who each video sharer was following on Twitter, and who they’re followed by. In technical terms, this gives us a ‘directional’ network with two possible ways for nodes to be connected. Analysing these connections highlighted some really interesting differences.
Metric #4: Degree, or ‘social connectedness’
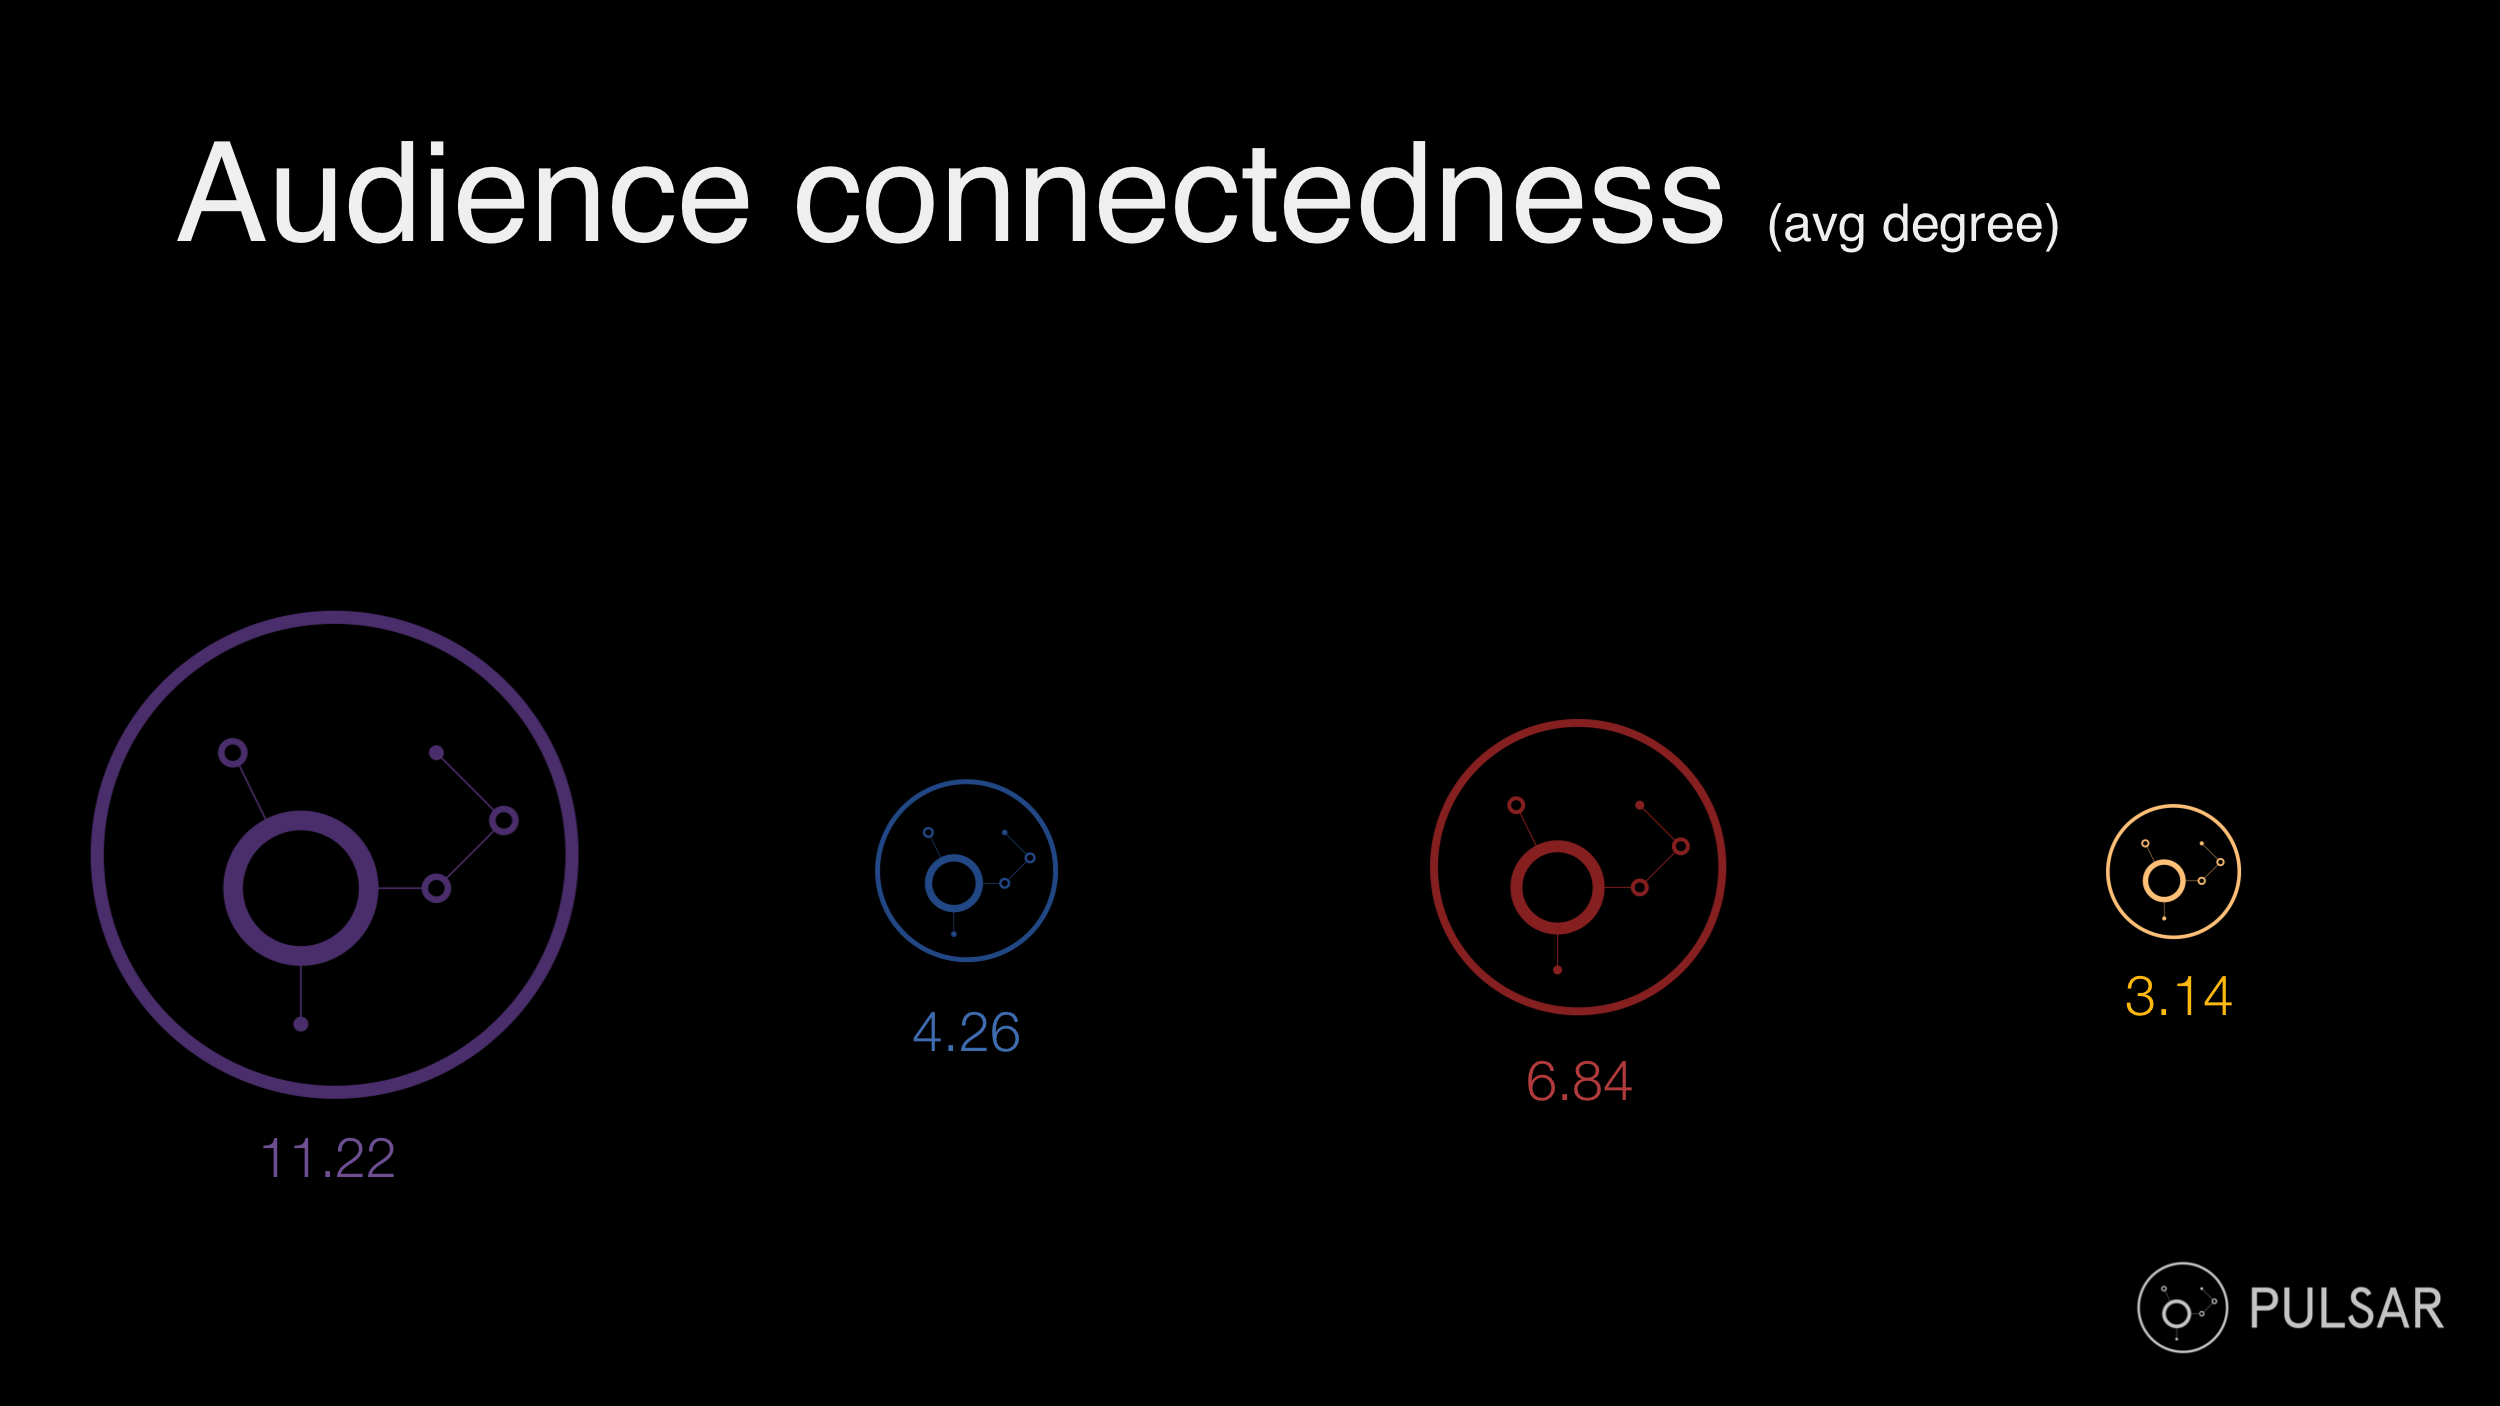
First of all we looked at the Average Degree of connectedness for each audience network. Each person in a network can be assigned a ‘degree’ value: that’s a count of the number of connections they have to other people in the network. We were studying how videos go viral and spread in Twitter, so those connections are easy to identify: it’s who they’re following and who they’re followed by.
Interestingly enough, the audiences of the Spiker memes (Commander Hadfield and Turkish protests) are showing the highest levels of interconnectedness – while the audiences of the Grower memes (Dove Real Beauty and Ryan Gosling) show the lowest.
Metric #5: Modularity, or “fragmentedness”
The memes that spread faster could do so because the audiences that engaged with them were highly interconnected. But how are this connections organized? To do this we used another social network analysis metric called Modularity. This describes how fragmented the network is and how many sub-communities can be detected based on the density of mutual social connections within clusters of users.
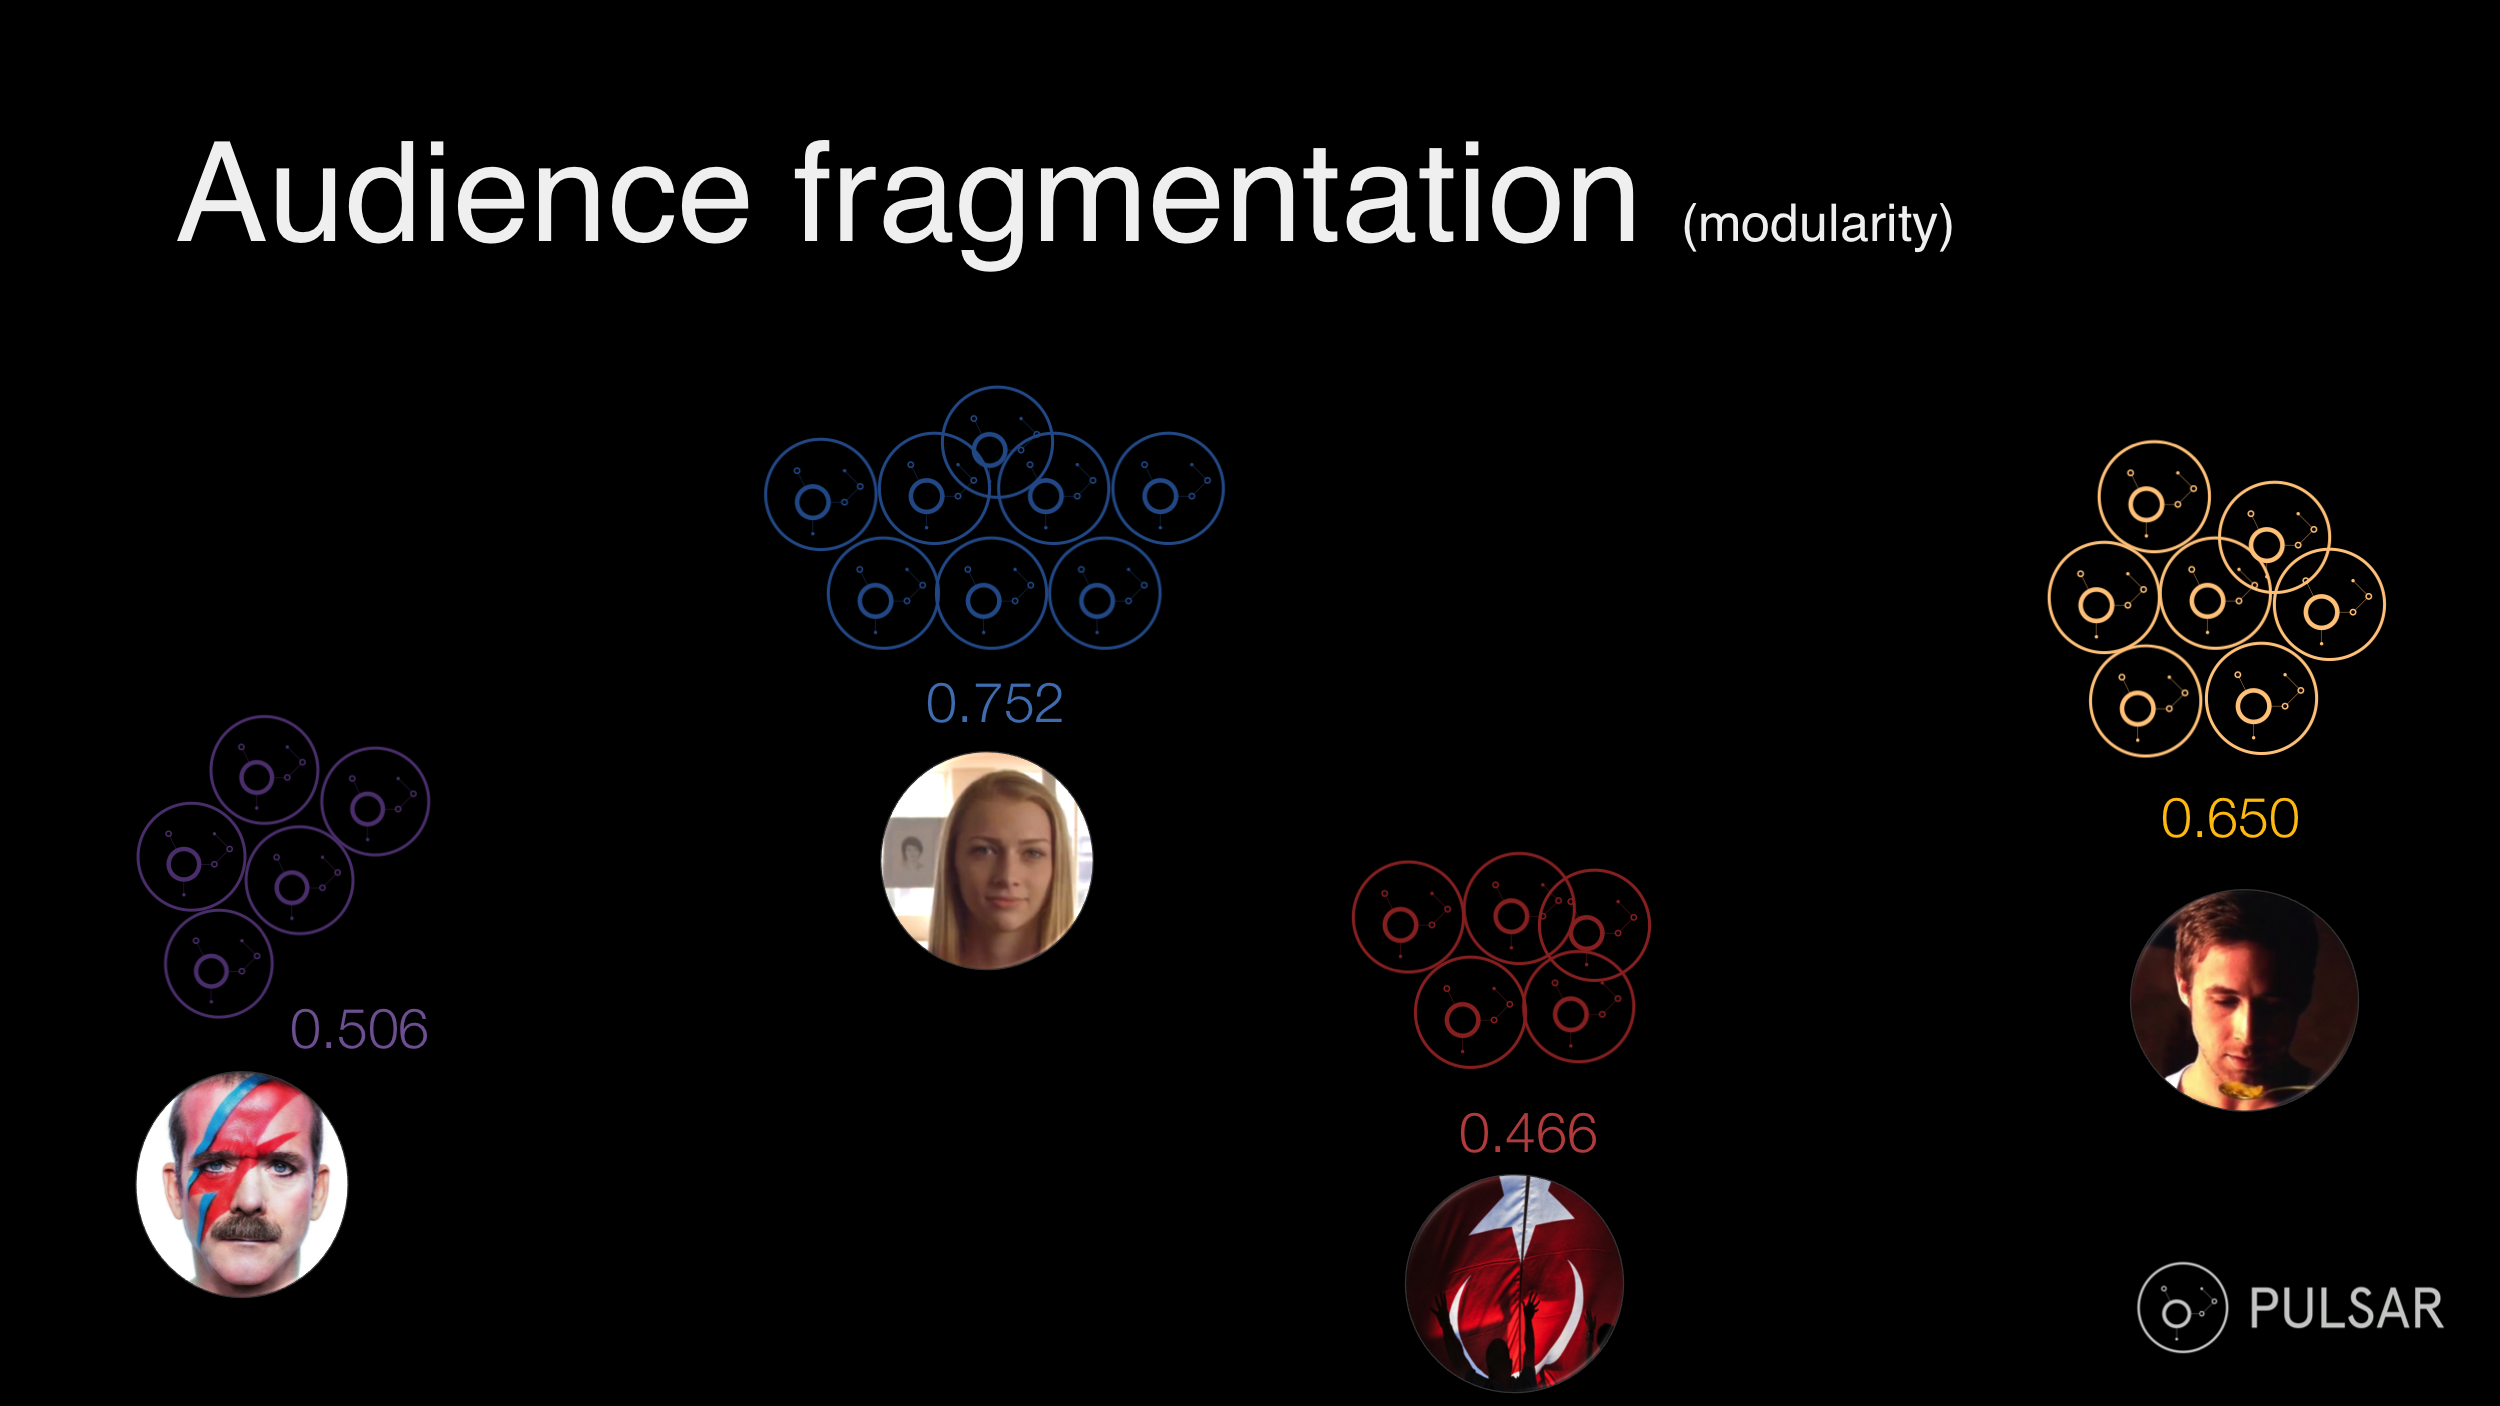
The lower the modularity, the less fragmented the audience is into sub-communities, the more cohesive it is and the easier to reach it is. Not surprisingly, the audiences of the Spiker memes are the most cohesive ones, while the audiences of the Grower memes are the most fragmented ones. Cohesiveness and fragmentation becomes much easier to understand when looking at the total number of communities identified within each audience.
Metric #6: the number of Communities
Social network analysis tools allow you to measure the number of ‘communities’ in a social network. Tools such as Gephi provide access to algorithms, such as the Modularity one, that can quantify how people’ s connections tend to gather together into definable ‘clusters’ of closely-connected groups.
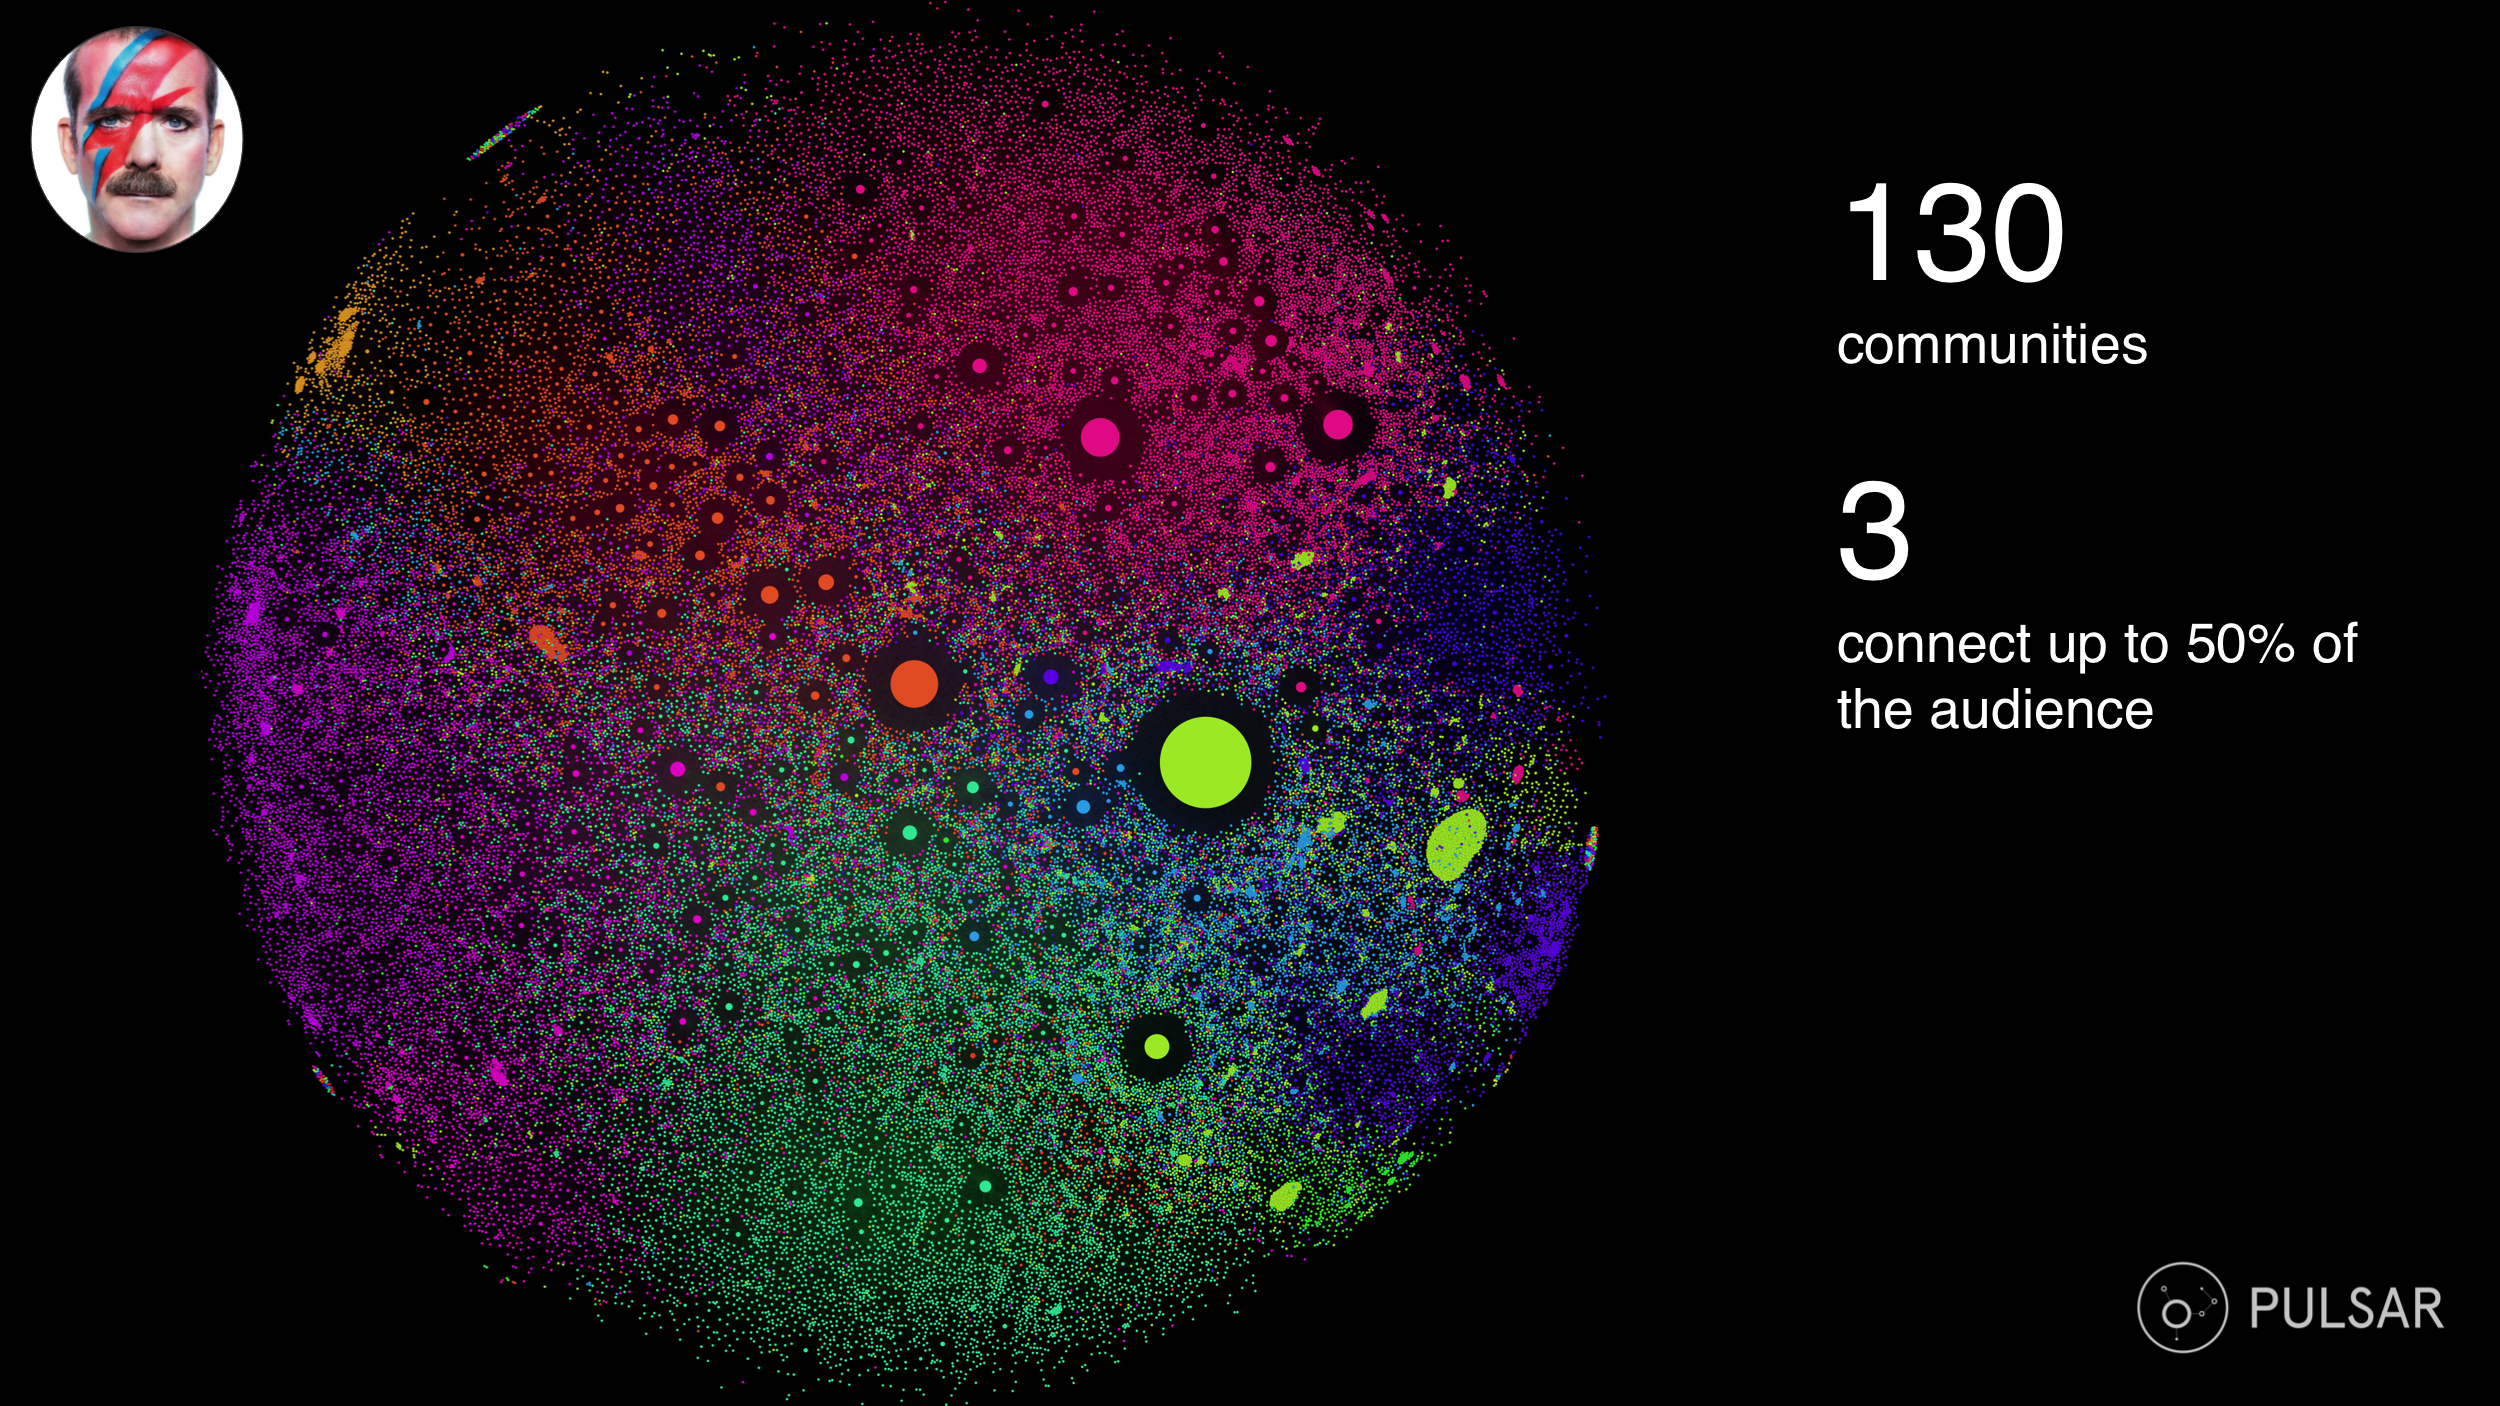
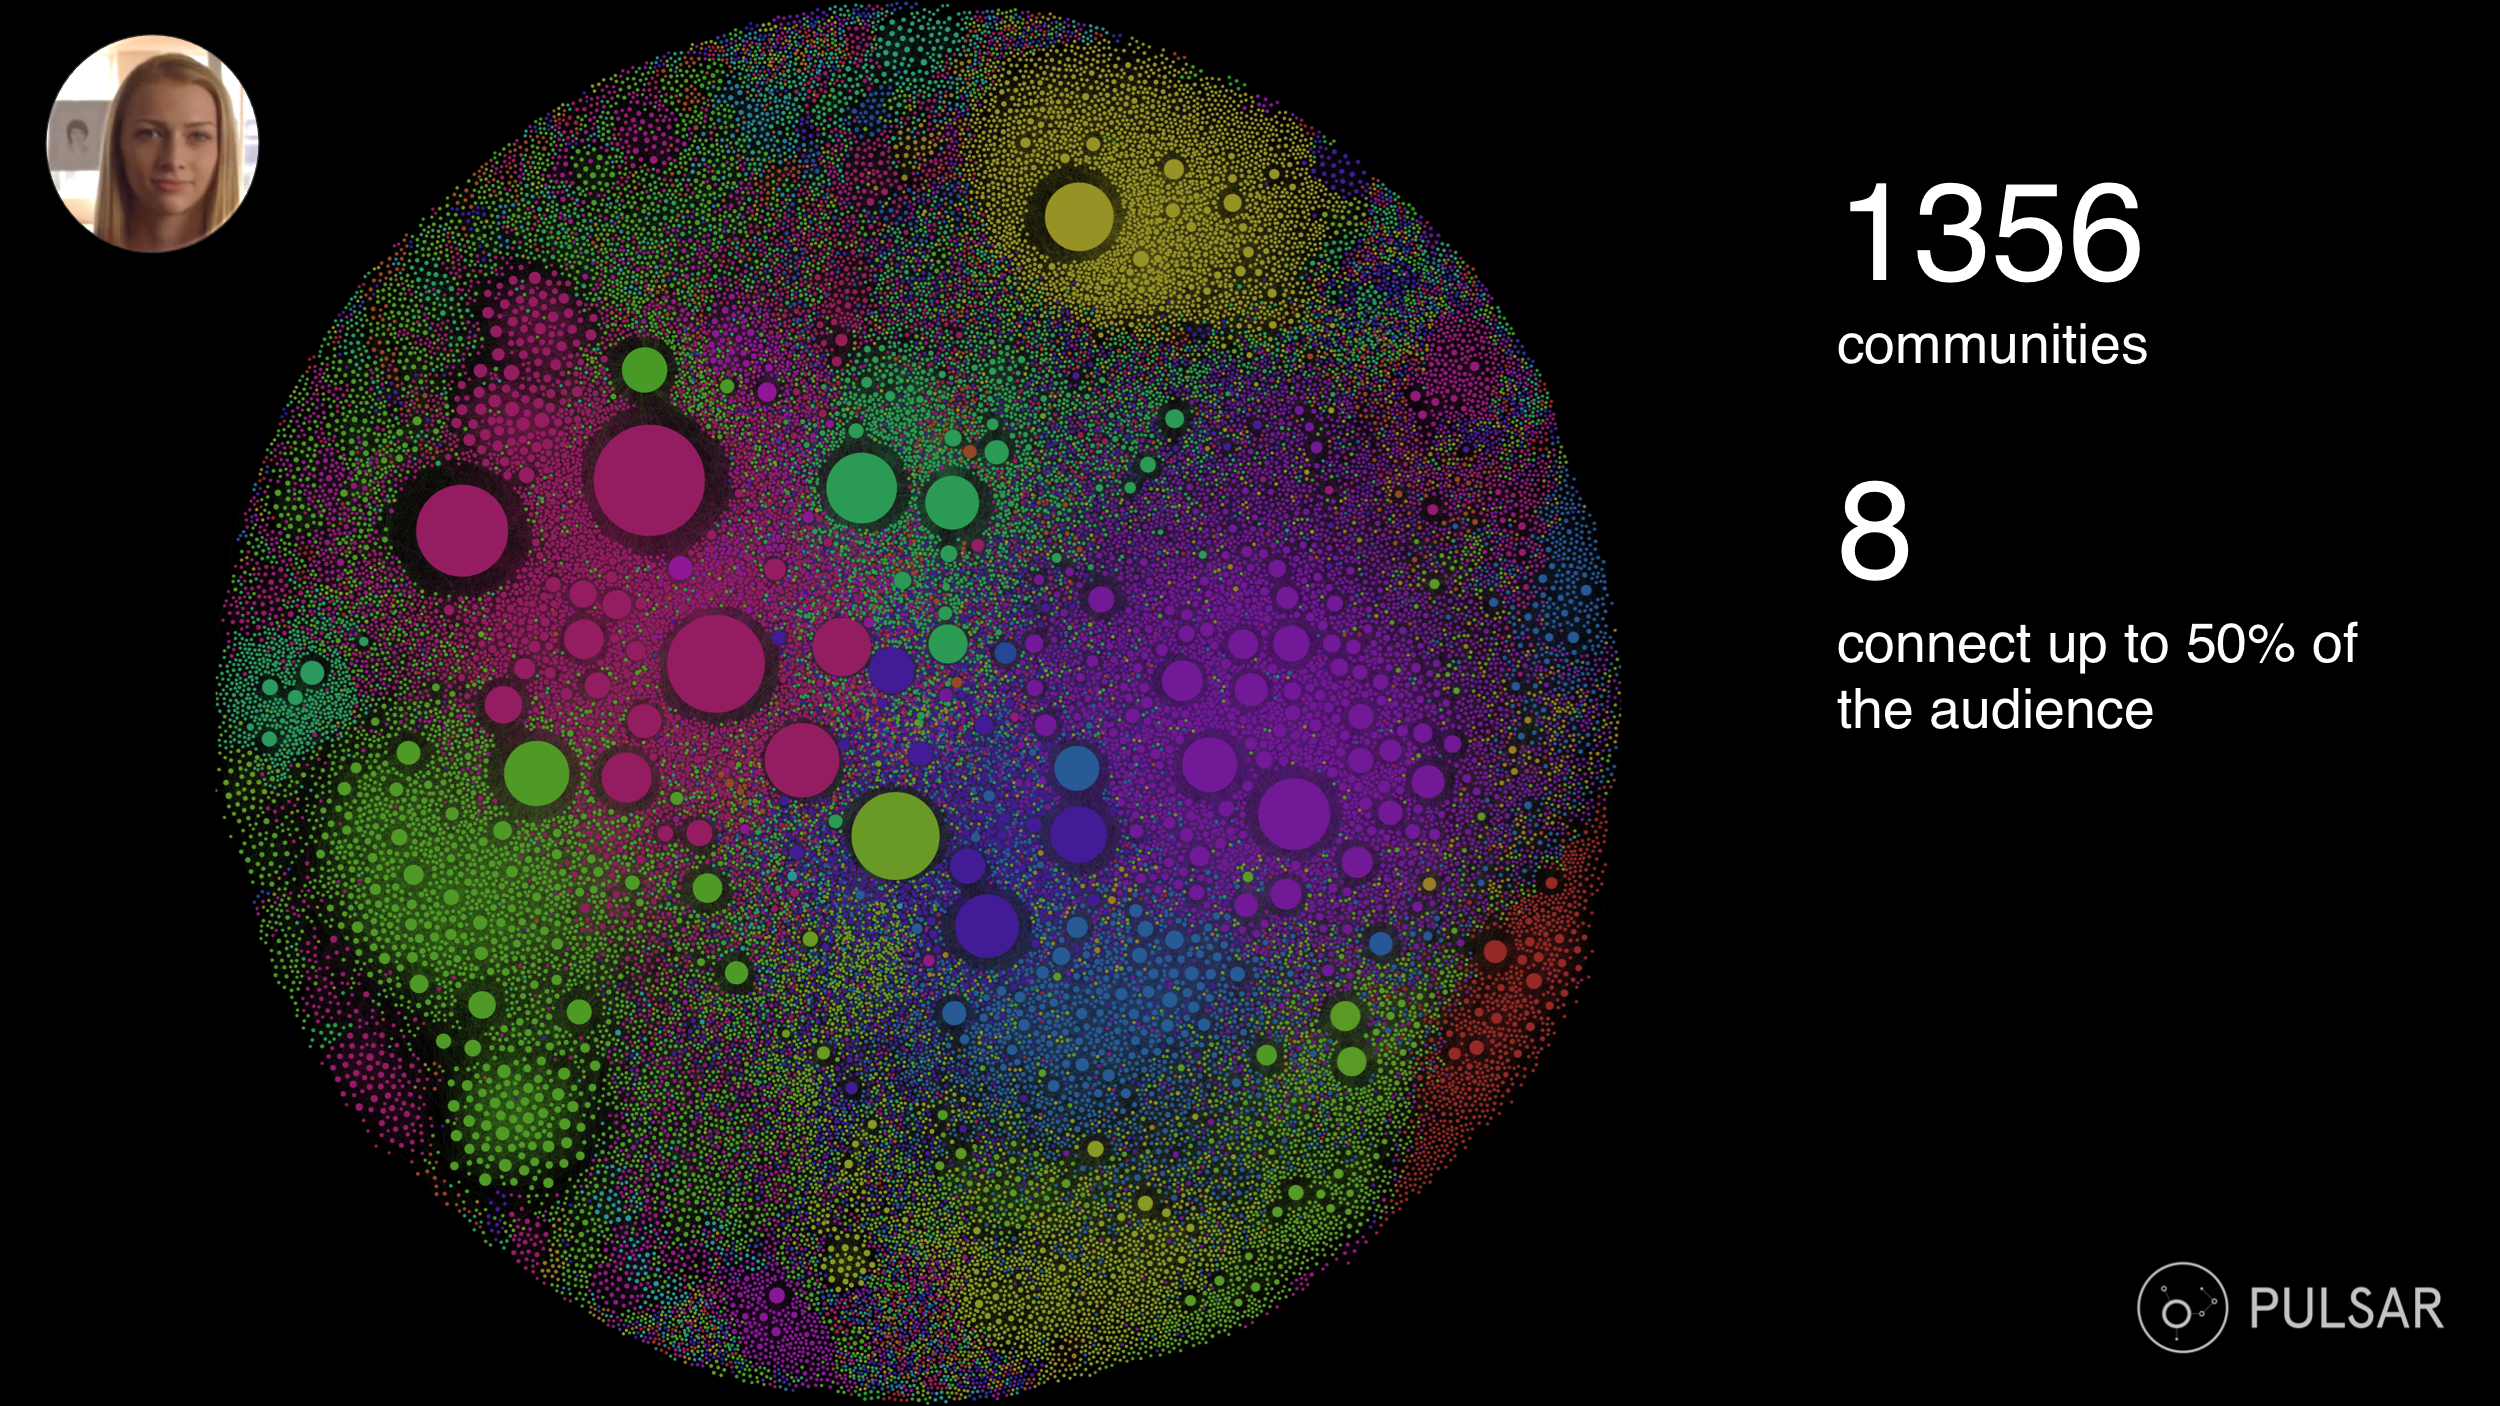
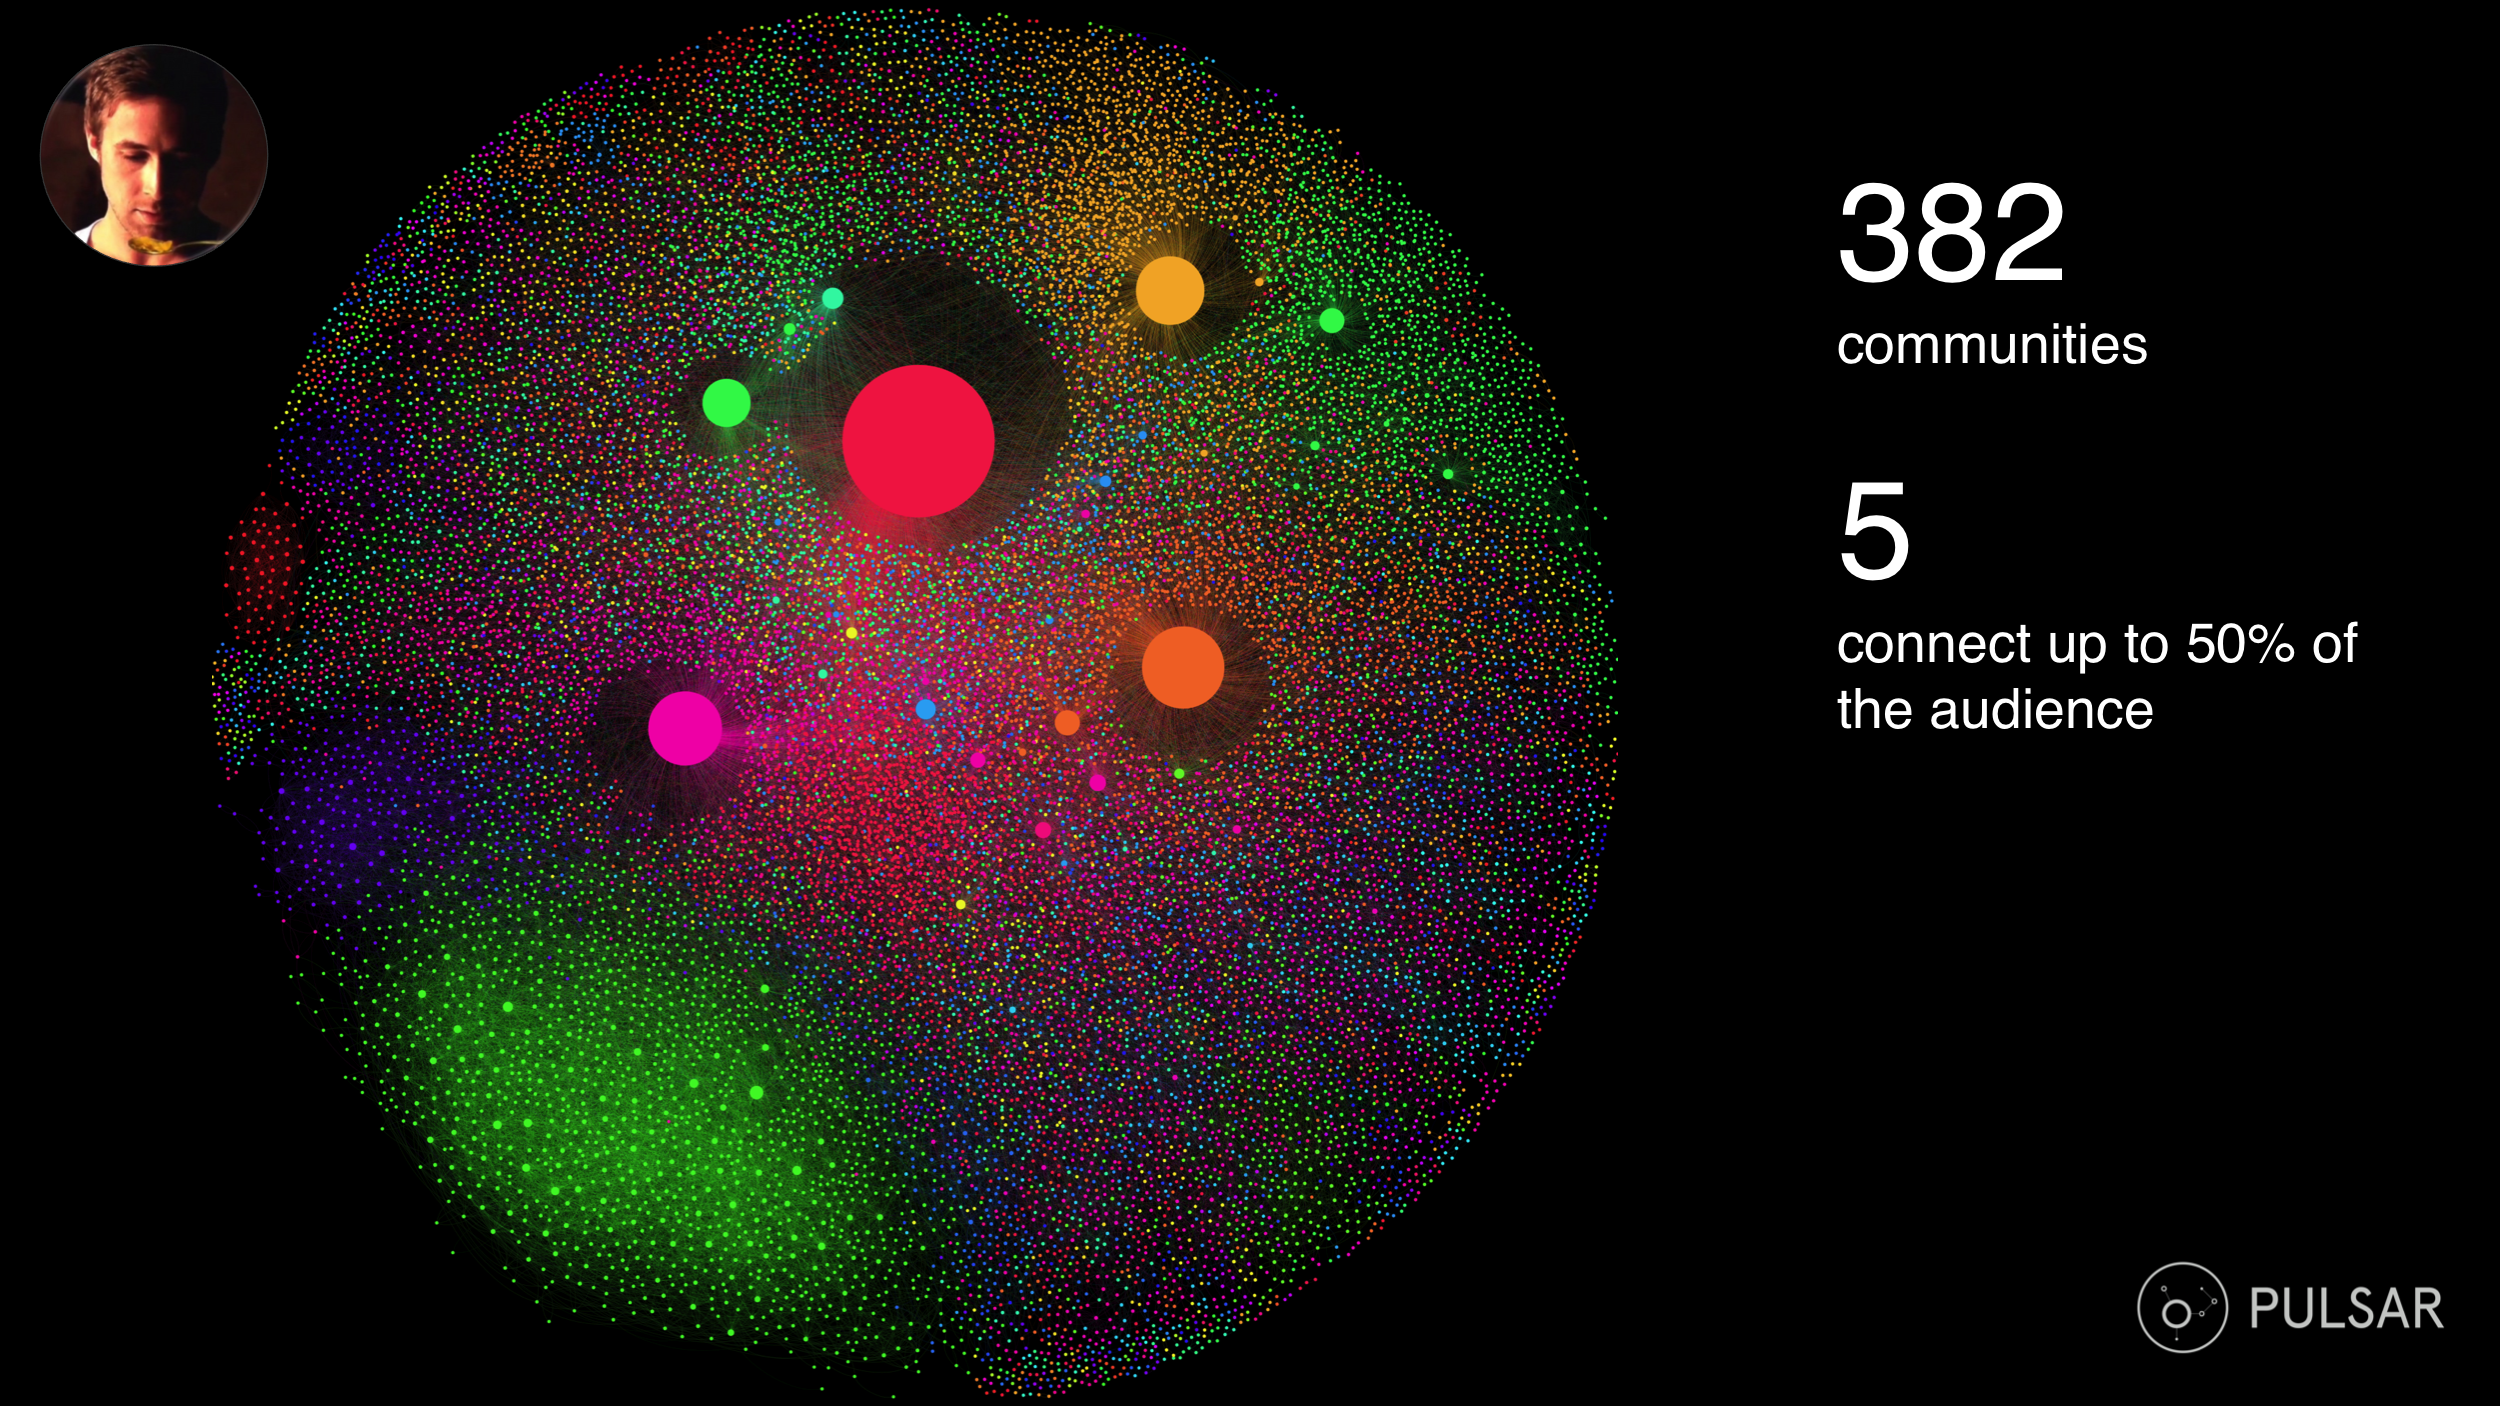
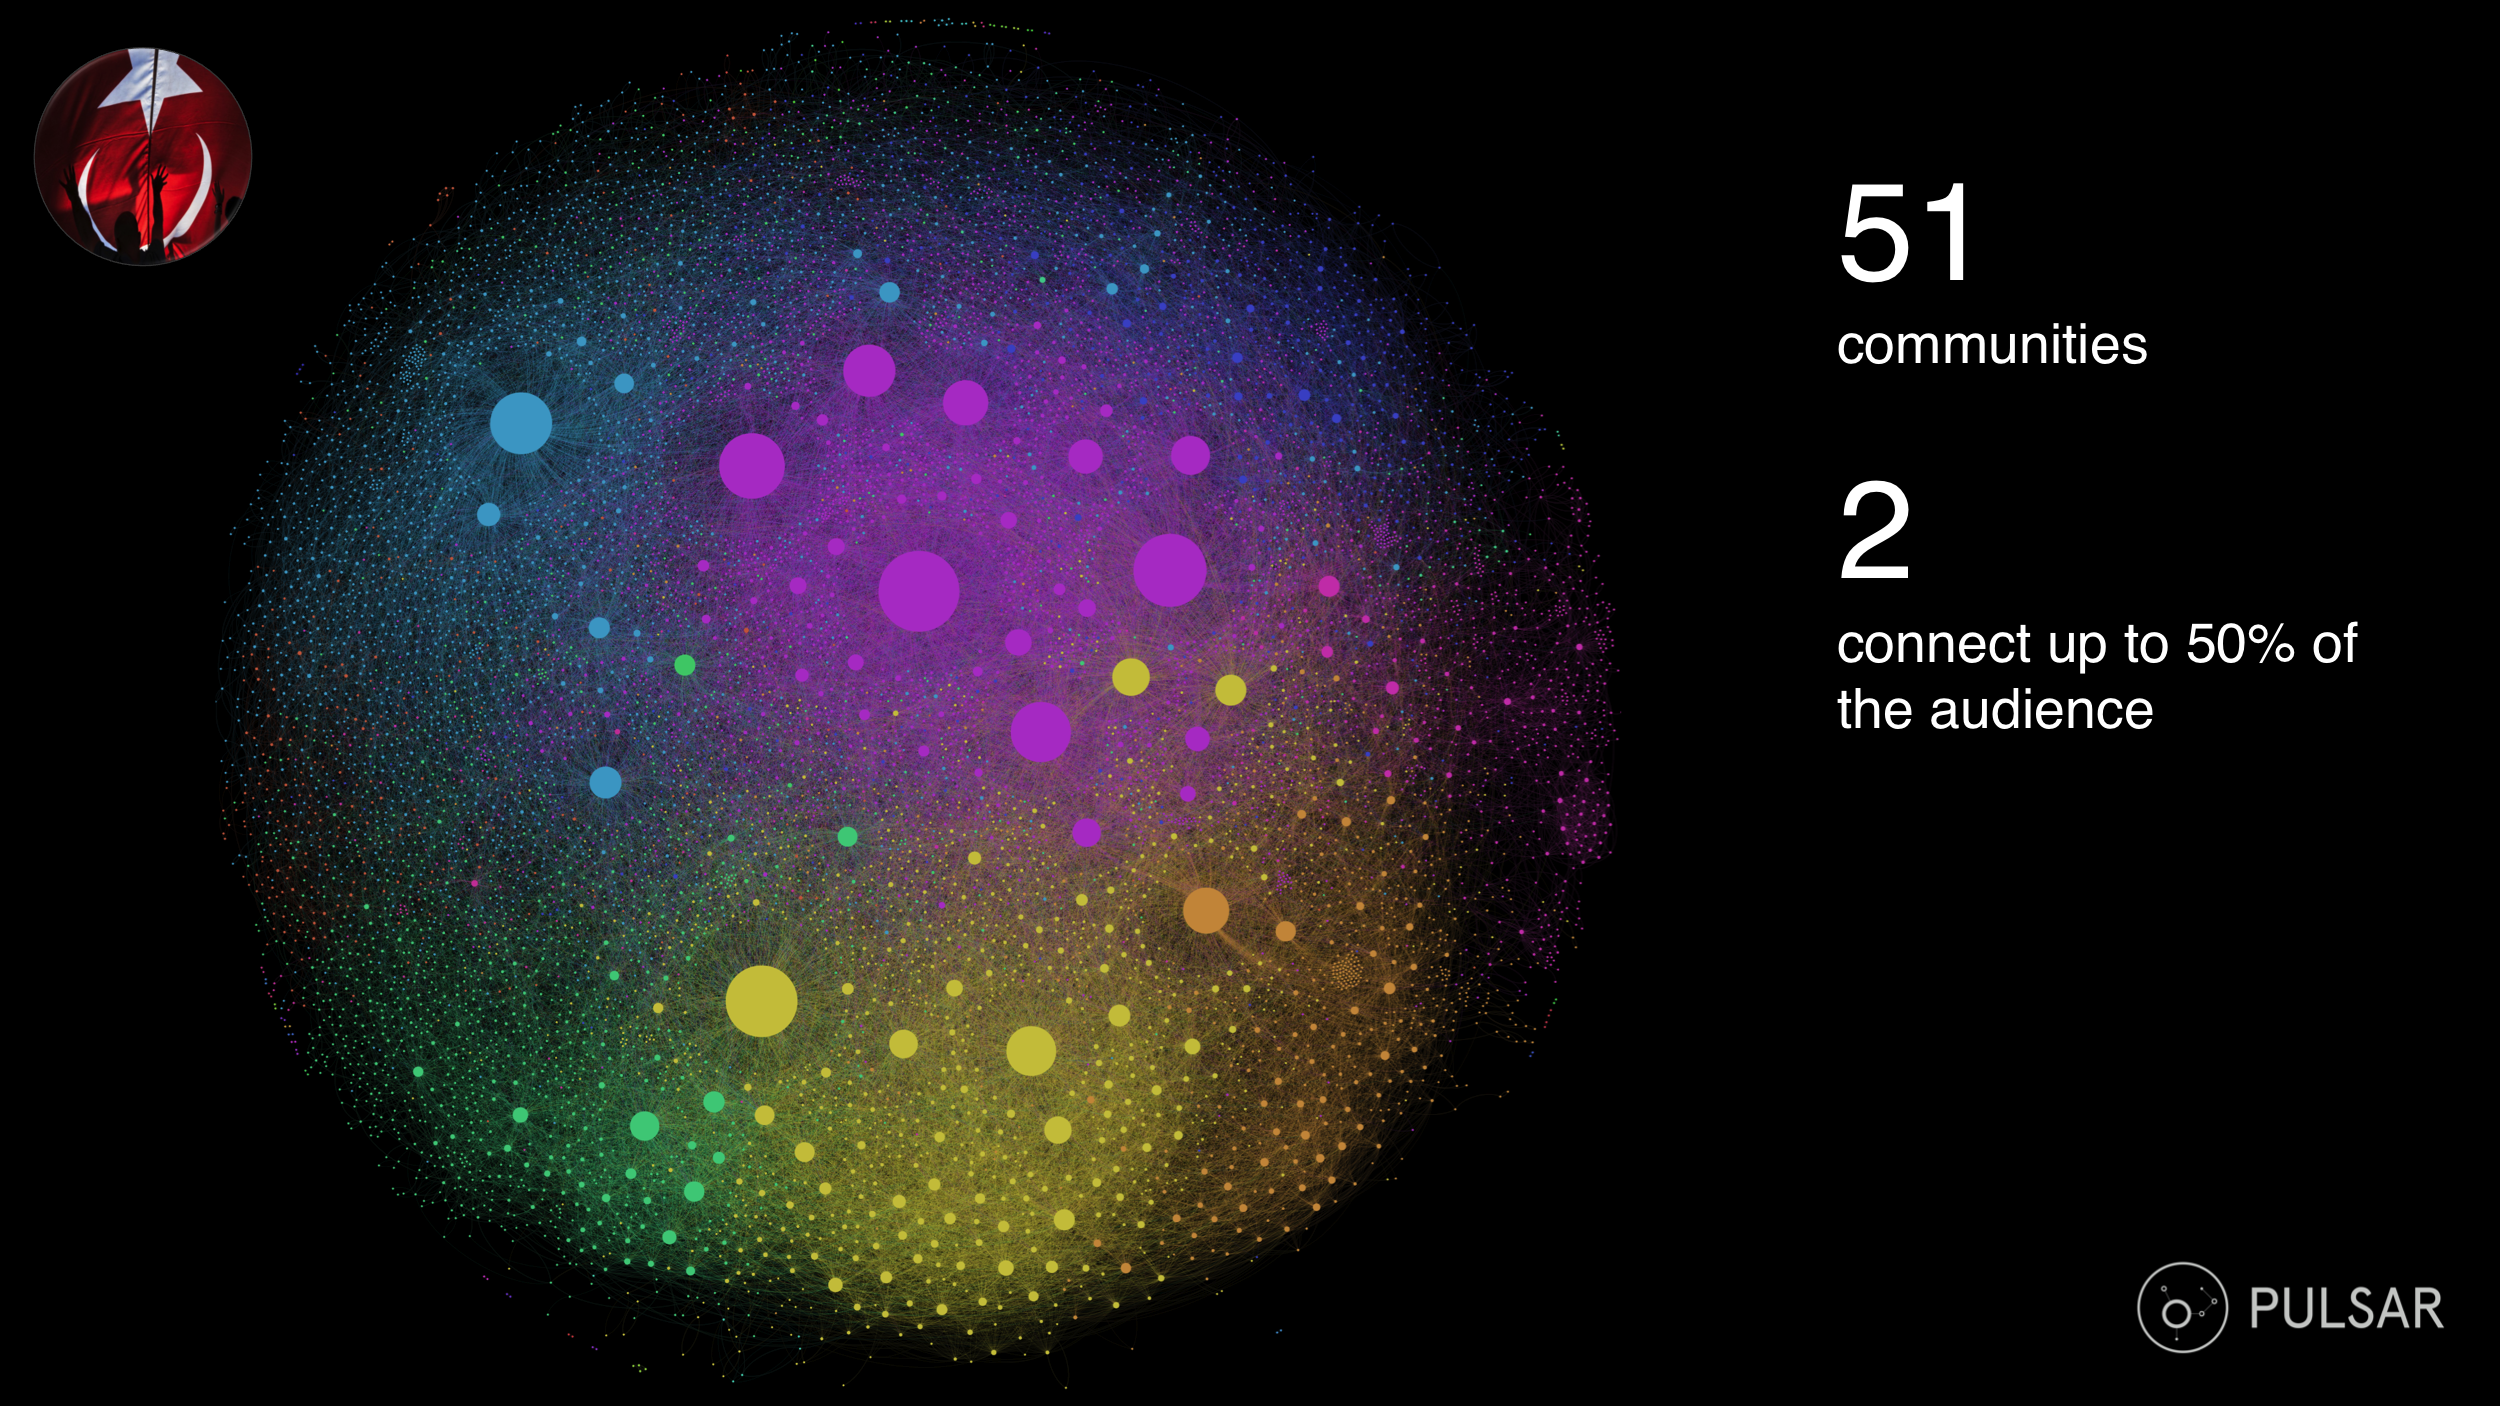
Whereas the audience of Commander Hadfield is split into 130 communities and the audience of the Turkish protests is split into 51, the audience of Ryan Gosling is split into 382 communities and the audience of Dove Real Beauty Sketches into 1356.
This has a strong impact on the ability of memes to spread through the audience network. Whereas reaching out to just 2 communities is enough to reach 50% of the audience of the Turkish protest, spreading the news to 50% of the audience of Dove Real Beauty Sketches requires reaching out to 8 communities. It follows, then, that where a meme has to travel through more communities to reach people, it moves a little slower – in a ‘grower’ model. By contrast, memes ‘spike’ where they take off in a small number of communities very quickly.

So what have we learnt so far?
Yes, the audience’s social structure – the way that people are connected within in – shapes the way something goes viral.
Audiences with a low Average Degree, low connectedness or low density, are more fragmented. The more an audience is fragmented into sub-communities (high modularity of the audience network), the slower a video or piece of content spreads through it . But what causes a higher or lower fragmentation within a specific audience?
Understanding the communities within an audience
To answer this question we tried to measure the demographic diversity of the audiences. The assumption being that an audience showing a higher demographic diversity will also be more fragmented and therefore slower to transmit viral videos.
So we ran the demographics analysis again on the four audiences: this time running it separately on each of the top 5 community clusters identified within each audience. You can see below the results for the top 2 clusters of each audience:
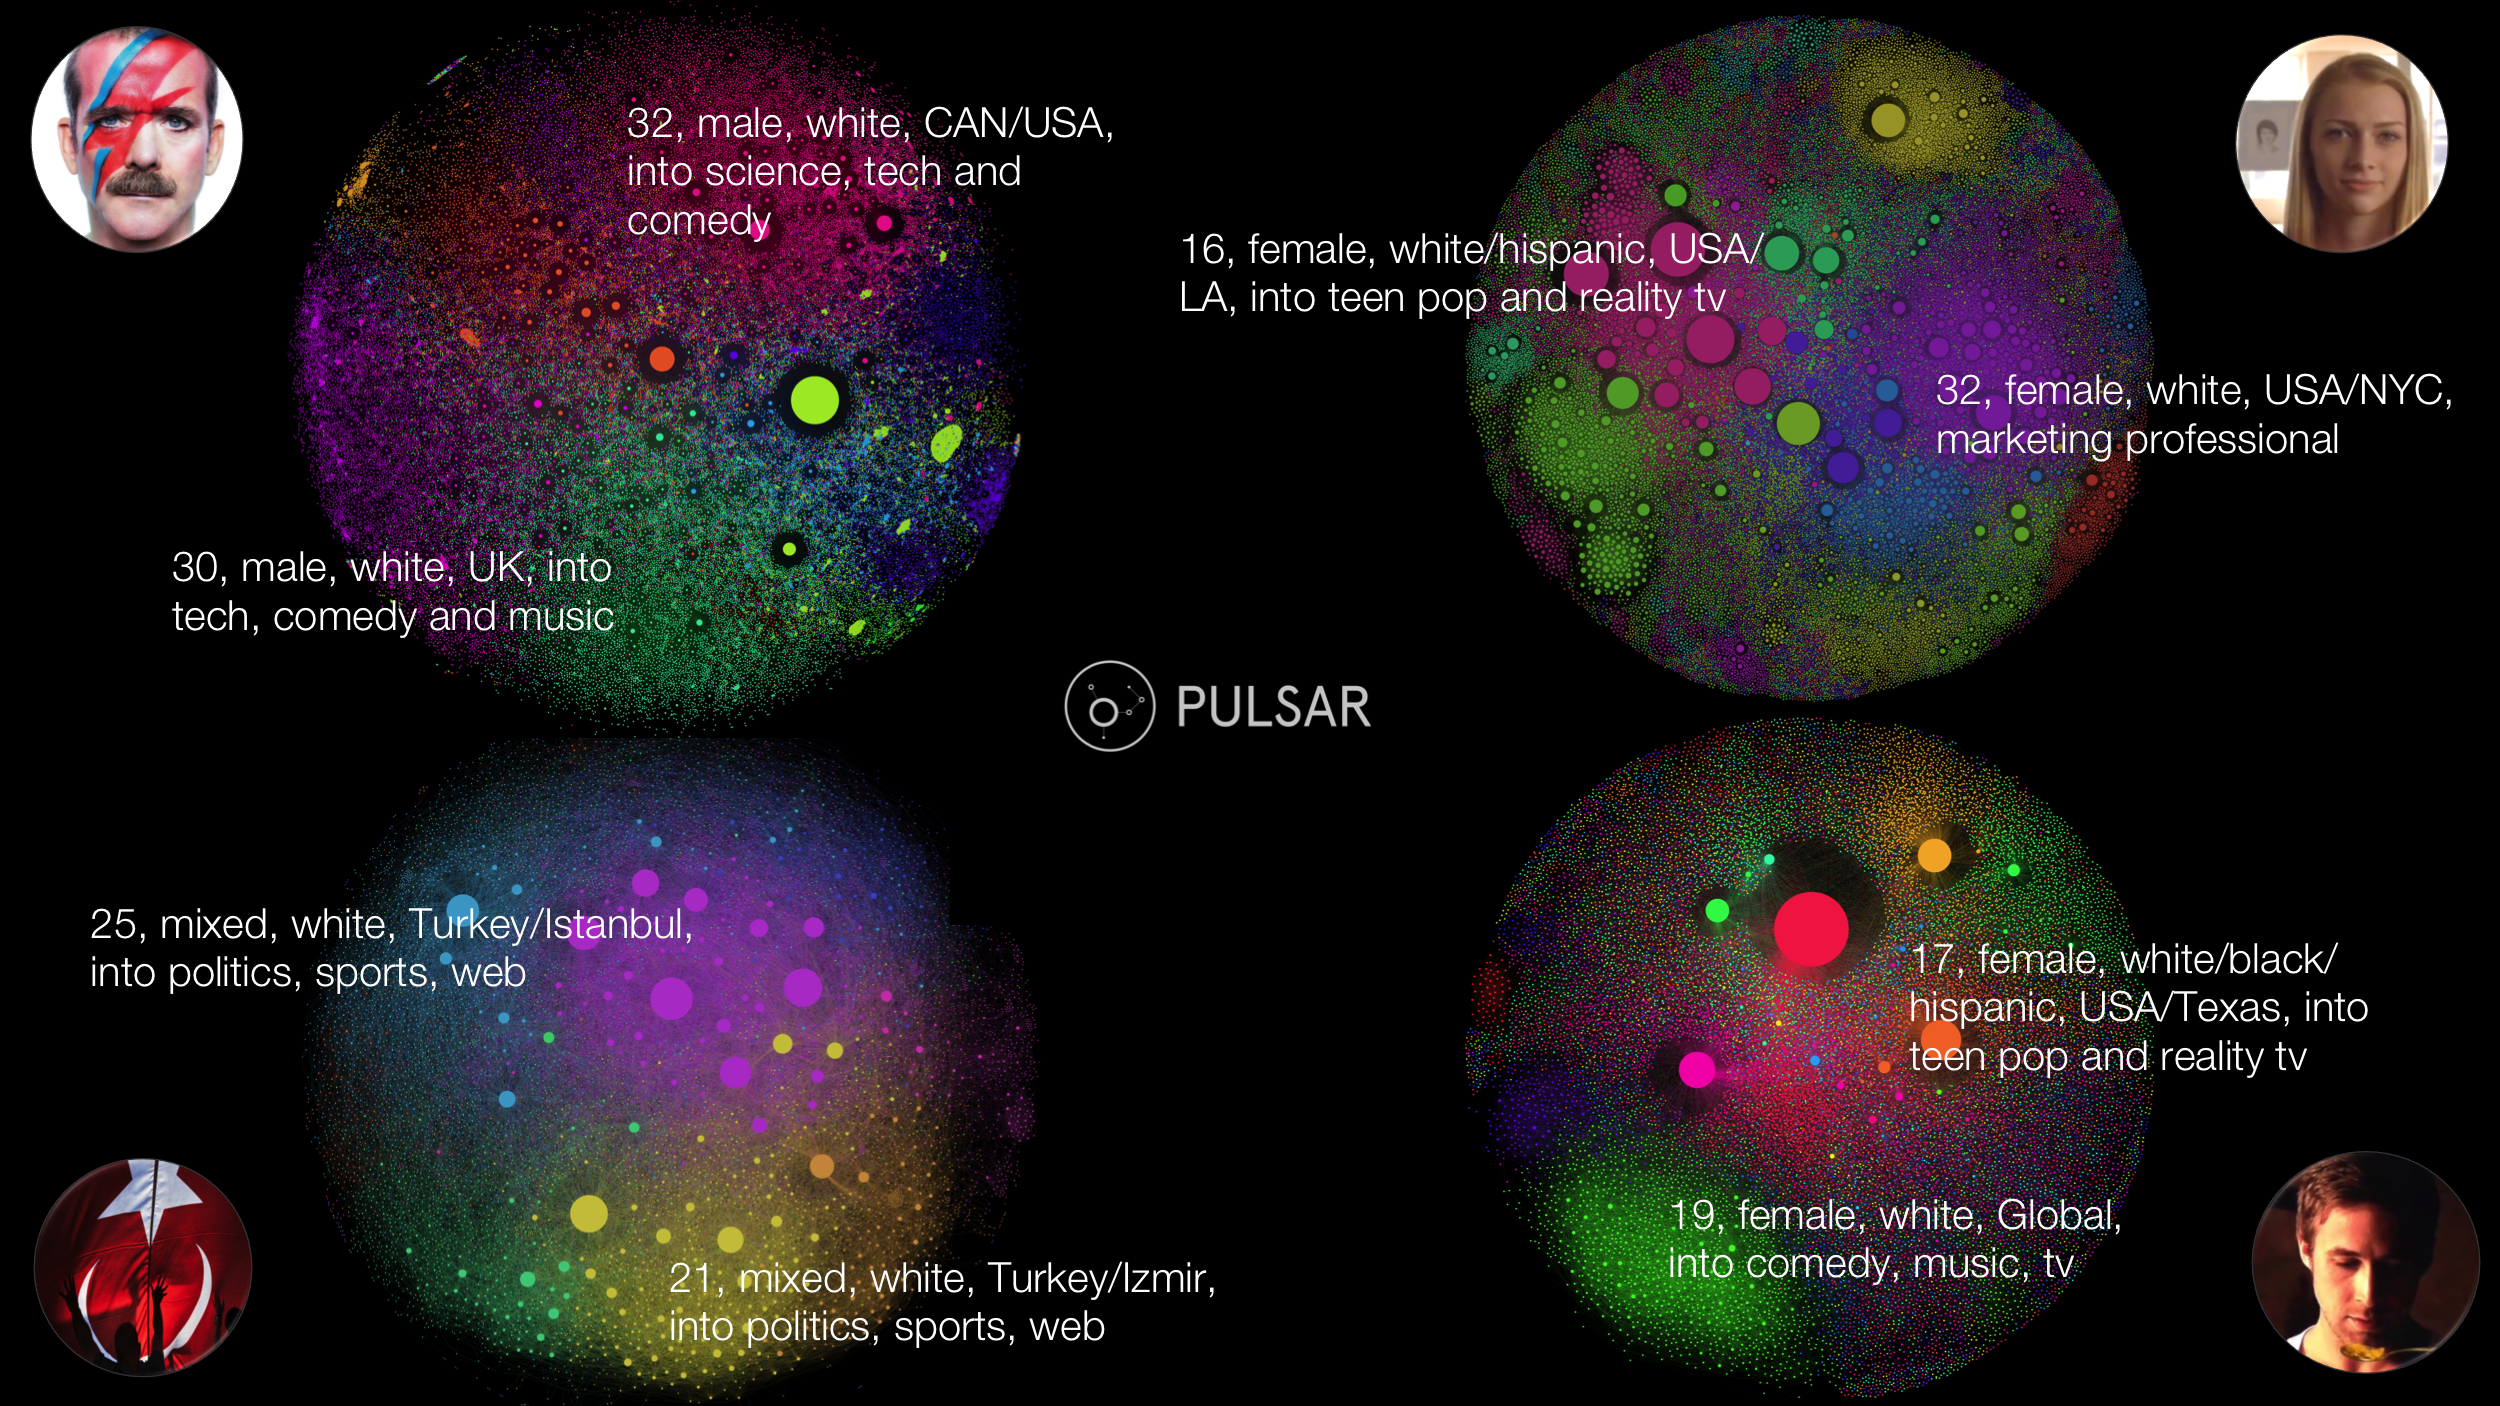
The audiences of Ryan Gosling and Dove Real Beauty Sketches show higher demographic diversity, while the audiences of Commander Hadfield and Turkish protests show lower demographic diversity. So high demographic diversity correlates with high modularity and slower meme velocity after all. How is this useful?
How the audience affects How Stuff Spreads
To start with, this means that a meme which is appealing to a broad demographic is probably going to spread slower than a meme that is appealing to a narrow demographic.
This also means that a meme with a broad demographic appeal is going to be more expensive to make go viral. Expensive because it will require more intense paid for seeding/advertising in order to reach out to a higher number of disconnected communities (Dove Real Beauty Sketches is a good example). It may also need persistent replication of the meme to break through the attention of multiple audiences who might not take notice the first time (Ryan Gosling won’t eat his cereal is a good example).
Finally, the organisation of the audience in sub-communities means that influencers lists by subject are pretty useless when trying to reach out to an audience. For example, your top 100 influencers for beauty might well all be part of the same two communities out of the 1356 total communities that make the Dove audience. So identifying gatekeepers and influencers is useful only once the audience you want to reach has been mapped and its communities identified.
The social dynamics of virality
In our previous post we identified and defined two models of virality: Spike vs. Growth.
From this audience and community analysis, we can now augment that with a 3-part model of how content is seeded through groups of people:
1) TRIGGER: A higher than average emotional response to the content triggers an impulse to share
2) VALIDATION: The impulse to share gets then validated against the community the user is part of. This validation happens both in terms of topicality (is this of interest to my audience?) and timing (has anyone else already shared this within my circles?). See this paper for more research on this aspect
3) ESCALATION: The gatekeepers (e.g. media channels, celebrities etc) share the meme helping it reach the tipping point within a specific community. The tipping point is when every member of the community is likely to receive the meme from another member of the community.
Once everyone’s seen the meme and starts to share it on themselves… That’s when you’ve got virality on your hands!
So what does this mean for you?
Content that generates an emotional reaction is more likely to go viral. People share to say something about themselves. Emotional content helps them figure out easily what it is they are saying about themselves by sharing it.
Picture the audience your content is going to be appealing to, and find them in social media. Learn who they are and what makes them tick.
Your online audience is not a monolith. Online audiences are organised in sub-communities and congregate around key demographics variables such as age, profession, passions and interests.
Map your audience and identify the key communities that are going to help you reach out to at least 50% of your audience.
Once the communities are mapped, identify the key gatekeepers by community and the connectors between key communities. This will help you reduce the outreach effort.
If your content is going to appeal to a broad demographic expect a longer run and make sure you have the right resources in place for seeding and advertising to a fragmented and harder to reach audience.
Good luck.
To learn more about virality and how stuff spreads, check out our posts in this series:
- How Videos Go Viral, Part 1: Understanding the Dynamics of Virality
- How Stuff Spreads: Gangnam Style vs. Harlem Shake
Want to dive even deeper? Request a free demo of Pulsar, and learn how our tools can help you reach data-driven insights about your content and your audience.
--
Study conducted by Francesco D’Orazio (@abc3d /LinkedIn) and Jess Owens (@hautepop / LinkedIn).
Spotlight
entertainment
Barge World Cup Stunts: Adidas vs Nike
media-entertainment