Identifying Top Influencers with Social Network Analysis
Part #1 of our Network Analysis series, by Rob Parkin
In our social media audience analysis and research work, we regularly need to answer clients' questions about online influence and influencers. Companies know that they are not the only force influencing perceptions of their brands, and they want to reach out to other people who are: this could mean identifying the right bloggers to bring on board to increase the likelihood of a successful social campaign, or tracking the accounts that are shaping the conversation about a certain topic or brand.
Pinning down who is influential is not straightforward. Influence is a complex phenomenon, an outcome of a combination of properties relating to people, contexts and relationships.
Data connecting a social media post with the actions it may have inspired –products purchased or businesses boycotted– is hardly ever available. Instead what we can really assess is ‘potential to influence’ through deeper social media audience analysis: who is reaching a big audience, who is engaging that audience the most and getting a lot of interactions, and who is demonstrating consistent expertise on a topic.
That is why we developed our own proprietary metric to analyze which messages are reaching the biggest audience. Our visibility algorithm assigns each piece of content a visibility score, taking into account the properties of the channel it’s on (e.g. blog content lasts longer than Twitter), the size of the author or website’s audience, and the virality of the post - how many times it’s been shared.
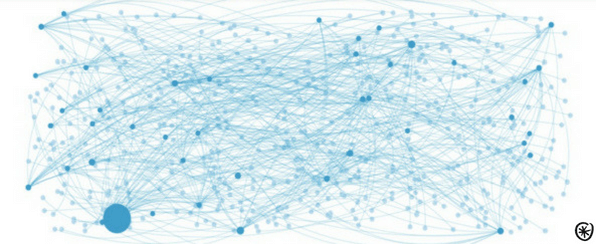
Influencers ranked by Engagement & RTs generated (Pulsar visualisation)
Alongside visibility, we also use Social Network Analysis to understand influence through analyzing the dynamics of online behaviors and relationships. It provides the theory, the algorithms and the software to capture, visualize and explore the data gathered using Pulsar. This can enable us to take influencer analysis to the next level – and it’s what we’re going to discuss in today’s blog.
The role of influencers
Previous research carried out by Francesco D’Orazio and Jess Owens highlighted the role of influencers in how information spreads through social media. It showed that while influencers may only represent a small percentage of an overall conversation, their role does ultimately shape how information spreads. Tapping into close communities makes content shareable, but top-down influence is essential for content to achieve truly viral speed and scale.
We’ll cover communities in more detail in our next blog, but for the moment let’s understand that influencers play a vital role in shaping conversations, and insight into how their influence is structured can also prove important.
Identifying influencers
In essence Network Analysis views relationships as connections. Some people in the network might have only one or two connections (e.g. they only have 1 or 2 Twitter followers), and others might have hundreds or thousands.
So hubs or influencers in networks can be identified by looking for people who are highly connected in comparison to the remainder of the network. Because they’re better connected, these are the people who you may wish to bring on board with an online campaign, to help maximize its chance of successfully reaching the greatest number of people.
So let’s look at an example that demonstrates how networks can help us investigate relationships between nodes and identify influencers.
Investigating my ego network
I’m going to use a very self-centered approach and investigate my Facebook network! I used an application called netvizz to capture the data, and Gephi to perform the analysis.
When compiling a list of influencers you may start with a very basic measure, the number of friends/followers. Using Network Analysis and my social graph, we’ll explore the limitations of this metric, and how we might do a better job.
Introducing my friends & family…..
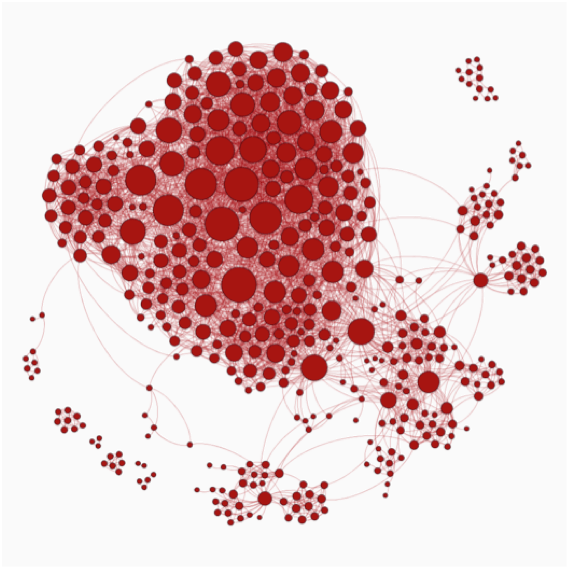
In this visualization the nodes are people who are my friends on Facebook, and the edges are the friend relationships between them. It’s important to note that I’m not on the chart – so the connections aren’t their relationships with me. Instead, the connections shown are the friendships that they have with each other e.g. I’m friends with Amy and Bob, and if Amy and Bob are also friends, there’d be a connection between them. If they’re not friends, no connection.
We can rank nodes by a number of measures; in this instance I’ve chosen degree centrality, which is the number of connections each person has. I’ve used this to determine the size of each node: the larger the node the greater the number of connections. This makes the highly-connected people easier to spot.
We’ve also used what’s called a “force directed layout algorithm” to visualize the graph. This means that linked nodes attract each other and non-linked nodes are pushed apart. So the most-connected people tend to end up towards the middle of the chart.
The first analysis that can be taken from the graph is that a lot of nodes share connections. This why why there is one large giant component in the centre of the graph with lots of highly-connected people all clustered together. This is to be expected as the sample of individuals is taken from my Facebook account, the majority of whom do share common acquaintances.
The thing is, we can also see that the biggest nodes are basically the same size, meaning that they’ve got the same number of connections. This isn’t really telling us the story we need - but using network analysis we can go further.
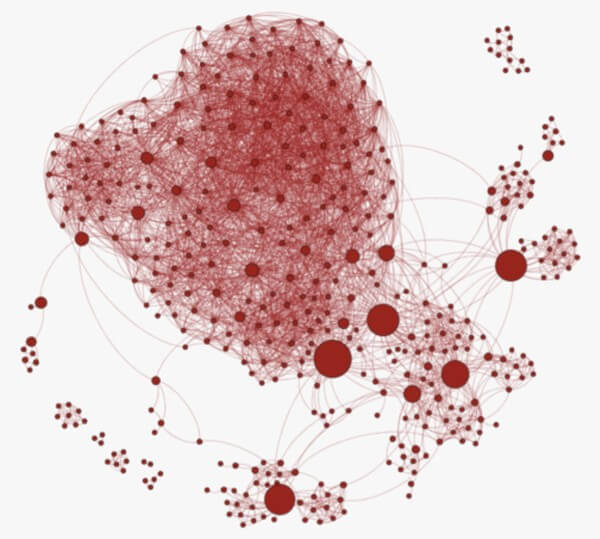
Here we’ve taken the same graph and ranked nodes by betweenness centrality. A betweenness centrality algorithm starts by finding all the shortest paths between any two individuals in the network. It then counts the number of these shortest paths that go through each node. Nodes with high betweenness centrality can be considered information brokers that can connect disparate parts of the network.
The result is a smaller list of potential influencers, pin-pointing the people who are vital in connecting the different sub-networks (i.e. the different social groups) in the wider graph. We have identified four people who are now shown to hold a position of influence on the graph. And the layout of the graph begins to tell us how their spheres of influence are structured.
The person over on the right for example is crucial in connecting two small clusters of individuals to the rest of the graph. I know network analysis has correctly identified this node as an influencer – because she happens to be my girlfriend! So she’s the key person connecting both our families to the larger network of my friends.
How can this work for you?
Admittedly there’s a very short list of people who are interested in the finer details of the network structure of my Facebook graph! Nonetheless it’s an interesting example to demonstrate some of the principles of Social Network Analysis.
What can we take from this example? Using network analysis it is possible to study social groups in-depth, not just as homogenous wholes but understanding them as comprised of dynamic relationships between different individuals. And using data visualization and data exploration it is possible to infer a level of understanding which would be otherwise difficult to get hold of without real-world personal knowledge of the individuals involved.
Using Pulsar TRAC it’s possible to scale up this analysis significantly, sampling mentions by keyword, content or user, and applying network analysis in order to:
- Identify individual messages driving engagement
- Explore who is influential in shaping a discussion
- Map a network of individuals following a brand online
- Better inform future outreach strategy
Exactly the same methods would apply if we were studying, for example, the community of people talking online about beauty & make-up, or audiophile hi-fi equipment, or photography. We could first find the best-connected people, who a brand might want to target to promote their product to the largest number of people. But we could also find the connectors, the people that allow discussions to travel into new communities and ultimately travel further.
In the next blog in our series we’re going to dive into this further, explore how we can identify twitter community networks and get stuck into some more network analysis we have previously carried out.
If you'd like to know more about how Pulsar can help you with your business, book a demo: it's free (and it will be interesting).