Detecting communities using social network analysis
Part 2 of our Network Analysis for Market Research series– read part 1 ‘Identifying Influencers with Social Network Analysis’.
Introduction
Social media research isn’t just qual or quant market research translated on to a different dataset – it’s got its own methods. We’re big believers in using the unique properties of social media data to answer questions that other research methods can’t get at.
And what’s special about social data, particularly on Twitter, is that with sufficiently advanced analysis platforms (Pulsar!) you don’t just collect the message, but also metadata about that message and its author. This provides the information needed to analyse how that message is shared through social networks – or alternatively the network of who follows whom. The result: proper social research that starts from the premise that people are connected, not just atomized individuals.
In the first part of this blog series we introduced some of the possible applications for network analysis in market research, revealing how network data visualization can enable you to identify influencers that have real-world meaning in the context of the social groups in which they belong.
I also discussed how influence exists in different ‘sub networks’ or ‘social groups’, and if we are to truly grasp the structure of these relationships then it’s essential to take these into consideration. It’s this point that the second blog in the series will expand upon. Here I’ll look at communities: we all know what these are, but what do they mean in terms of social network analysis? And what can you learn from identifying them?
Why look for communities?
When investigating the role of influencers we highlighted previous research carried out by Francesco D’Orazio and Jess Owens: the How Stuff Spreads project. In this research we discovered how communities are vital in driving the spread of information. The more communities there are in the audience, the slower viral content spreads, as it takes time to spread between the different groups.
So that’s one reason to understand social media communities – if you’re trying to spread a brand campaign or a piece of content, you need to understand the audiences it travels through. Different groups may well benefit from different messaging specifically targeted to their needs and interests – not one size fits all.
Understanding communities is also important to ensure your influencer program is comprehensive: have you got influencers in all the social groups you want to target?
How are we defining communities?
A community is most often defined as a group of individuals living in the same geographical location. It can also be used to describe a group of people with a shared characteristic or common interest: the research community, for example Within the social sciences, there is also the approach that views communities as something socially and symbolically constructed, resting on a shared understanding that “I am part of this community alongside these other people”. Political scientist Prof. Benedict Anderson defined the nation state as an “imagined community” (1983).
Using social networks analysis we define communities differently – by looking at how people are connected to each other, and clustering these into similar groups.
So it is a statistical measure of connectedness, and it’s not based directly on whether these people would recognize themselves as being part of the same community. However, what’s so fascinating about networked community detection is that the communities it identifies very often DO have significant real-world meaning, and can help us explore what it is that is defining communities.
How to identify communities? Using a social network analysis program such as Gephi, we can use a clustering algorithm called "modularity" to detect hidden patterns in the network. Modularity looks for groups of people who are more densely connected to each other than would be expected if they were connected by chance. . A network with high modularity has dense connections between nodes within clusters, but sparse connections between nodes in different clusters. As a result all individual nodes (people) in a network can be attributed to a specific cluster, as determined by the modularity algorithm.
A real-world example: my Facebook social graph
Let’s start by revisiting the ego network from my Facebook graph that we investigated in the previous blog. When identifying influencers in the graph I mentioned that it’s vital to pin-point people who the key connectors between different sub-networks on the graph. I was able to provide some real-world context to the data due to my personal knowledge of all the individuals in the network. But even on a small dataset such as this, modularity allows us to develop an even more granular understanding of the relationships.
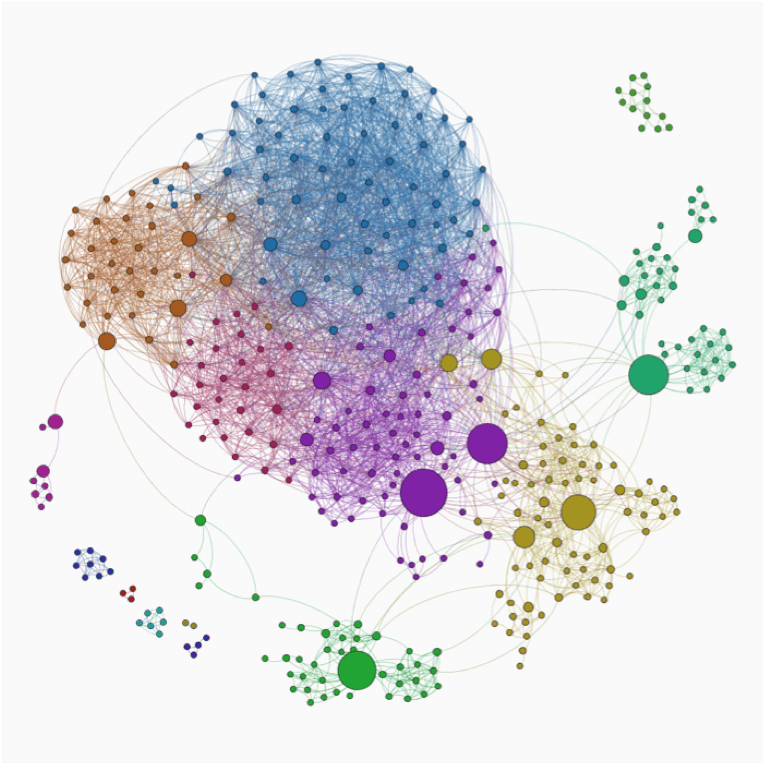
Here nodes are portioned by modularity, with each node belonging to a separate cluster or community, and coloured accordingly. For many of the separate and very distinct clusters on the edges of the network, it shouldn’t come as a surprise that these people belong to their own community.
What is interesting is within the main component, where without the colour coding it’s hard to see any clearly divided partitions. But now we now have four different communities (blue, brown, purple & maroon-ish). So the question is, are these 4 different groups just statistical figments of the network structure? Or do they relate to anything real about the relationships between the people involved?
- The blue community is made up of people I met at school, all around my age (17% of the network).
- The brown community is people I went to school with, but also lived close to where I grew up (9% of the network).
- The maroon community also went to school with me, but all at least a year older that me (7% of the network).
- The purple community is people I attended college with directly after finishing school (also 17% of the network).
This is a great example of how we can segment individuals by very subtle differences, simply by analyzing the structure of the connections they share.
But how could a network “know” these things about my friends? Well, it’s all based on the connections they have with each other. People who were in the same yeargroup at school are more likely to know each other, and therefore be friends on Facebook – so that’s what connects the real world to the network relationship.
Large scale network analysis
Strictly speaking I could have analysed my Facebook social graph manually – I know who my friends are friends with, after all, so I could have drawn the network manually (though it’d have taken a long time).
But network analysis becomes even more powerful when the analysis is scaled up to a level at which manual analysis is impossible. Using Pulsar to gather our data means we can use network analysis to investigate the relationships in networks of thousands or even millions of people, where obtaining an understanding of the real-world relationships that make up the communities isn’t anywhere near as straightforward.
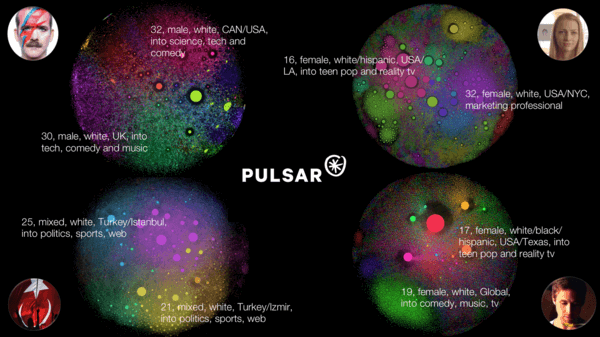
Reverting back to our previous research into How Videos Go Viral, you can see that modularity and partitioning has been applied on the audiences in the same way it was applied to my Facebook graph. We then applied statistical modelling of the demographics of each group to understand who was in each.
So for the Dove Real Beauty Sketches video (top right), we can see there’s one community averaging 32-year-old white women, in the USA/NYC, working in marketing – and another of teenage girls in Los Angeles who may be white or Hispanic, and who’re into pop music and reality TV. And indeed, it’s that appeal to a diverse audience that made the Dove advert so successful and the most-viewed on YouTube.
How can this work for you?
Think of communities as very similar to the segments identified in a brand’s customer segmentation model. (With demographics analysis layered on, you might even find that they’re the same.)
While direct marketing communications is often customized by segment, historically this hasn’t been something brands have done in social. But, using social network analysis and also Twitter & Facebook ad targeting, it’s possible to send specific messages to specific groups of people.
Powered by Pulsar TRAC these could be people engaging in a specific conversation, individuals sharing a piece of content online, or the followers of an account on Twitter. Any group of people, in essence, as long as we can define that audience through some property of its behaviour in social media – such as keyword, user bio, or location.
Community analysis allows brands to really understand audience behavior in a way they can’t replicate with offline, non-social data.
It enables brands to get maximum benefit from their influencer outreach and content seeding, by ensuring they’ve got contacts in each sub-community of their audience.
And once communities have been identified, there’s scope for deeper analysis of how each community interacts with brands, the language they use, and the topic . This can allow for truly customized marketing, allowing brands to understand each group’s social media behaviour, and how best to communicate with them.
Network analyses are also great communication tools – each time we put one on screen at a conference, the cameras come out and people start taking photos. We’d love to see more companies going public on their network analysis, and illustrating their audiences back to their followers. As we said earlier, community isn’t just about shared interests but a shared imaginary, a shared recognition that “We are part of the same group.” Sharing community visualisations could be one tool for a brand to create a real “customer community” – moving beyond individualized buyers towards positioning their brand as a source of meaning and identity.
Thanks to Jess Owens for contributing her ideas to this blog post.