Social Q&A: #4 Why you need to know about historical previews
In this series, our Head of Account Management Jamie Watson addresses frequently asked questions about audience intelligence platform Pulsar. Whether you’re a frequent Pulsar user or still evaluating a social media research platform for purchase, Jamie’s tips, tricks & useful info aim to highlight what to look out for.
After discussing the breakdown of historical data per source a few posts ago, today’s topic is all about the data previews that you see before you hit the launch button to actually run your historic search. Basically, it’s a graph showing you what to expect in terms of data volume without actually pulling in any data.
So what’s the deal with these previews and why are they important? Firstly, there are a few important considerations to be aware of when you see your preview, and secondly, there are a few interesting opportunities that you may not be aware of – yet.
Where can I run historical data previews?
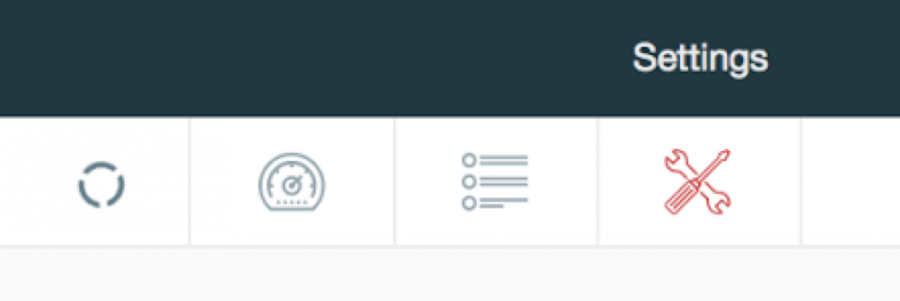
The historical data previews and collection initiation can be found by simply clicking into the settings icon on the top tool bar (shown in red below):
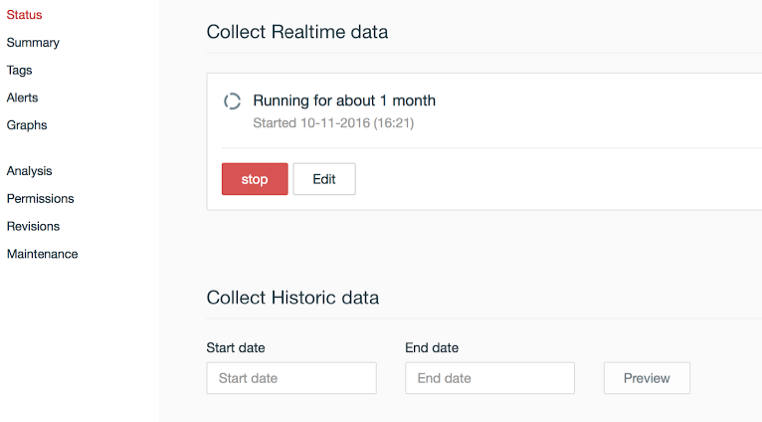
This will take you to the status page, where you can launch your search in real-time, or where you can preview and launch your historical data search:
What considerations do I need to be aware of when running previews?
- The historical data preview will cover Twitter, Tumblr, Forums, Blogs, News and Review sites, with the previews only going back as far as the historical access covers. More detail on this can be found in my previous post.
- Regardless of the location filters applied to the search, the historical data previews will show global volumes. This means that if you are tracking a global topic of conversation, however are only planning to bring back data from the UK, you can assume that the data volumes in your launched search will be lower than the estimated preview results.
- Once you are happy with the search strategy and previewed volumes, you’re ready to launch the search. Following this launch, the order will be reviewed by our Account Team to ensure that the volumes are with in your allowance before being authorized. When that’s done, your dashboard will start getting populated with your search results.
What other uses and opportunities are there for previewing historical data volumes?
Tons – it’s a very useful feature. I have included a number of uses that the team and I use daily:
- Using historical data volumes to predict real-time results – when you’re setting up a real-time search and you’re unsure of the volume of mentions you’re going to pull in once the search is launched, running a historical data preview for a few days is a great start to understanding whether your search might be too narrow or too broad. As a side note: when you’re incorporating this in your real-time search preparation, you will also have to prepare for YouTube, Facebook and Instagram posts that will not be visible in the historical previews.
- With the historical data previews, you can actually utilize quant volume metric with no real intention to even launch the search, therefore not using any of your data allowance. For example, the other week a client asked me to compare volume of conversation of Trump vs Clinton on Twitter over the past 6 months. To achieve this, I simply set up a search and ran the previews, took the numbers away and had my volume comparison cheap womens air max 90. No data needed, results delivered.
- To take this one step further, once you have previewed the data, you have the opportunity to export the daily volumes from Pulsar into Excel using the dropdown on the right hand side of the preview:
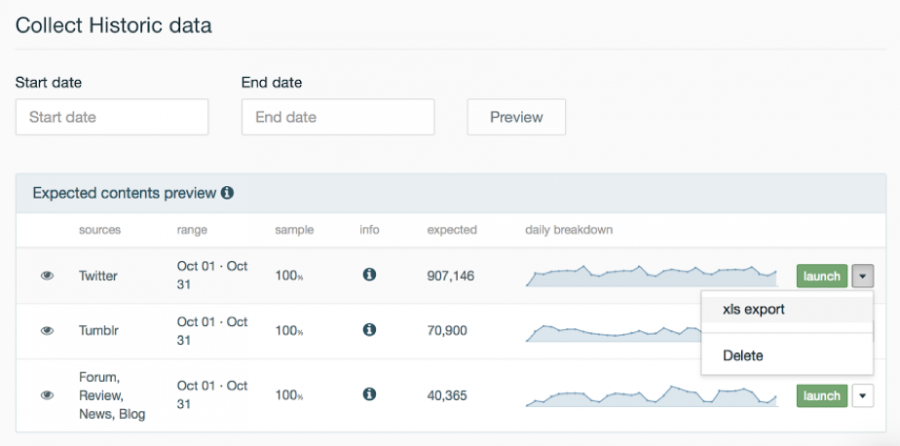
This allows you to see any interesting spikes in conversation that I may wish to investigate further in the dashboard, while also allowing me to collate the data in Excel and overlay my Trump and Clinton searches on one chart to show the comparison.
This snapshot reporting functionality is great for:
- Ad-hoc questions from clients / stakeholders where only a topline view is needed on a very broad question.
- Snapshot stats to include in quick turnaround pitches
- As part of your desk research for more exploratory searching. For example, if you are tasked with mapping the packaging category, this could give you a really good idea of seasonality and when these niche conversations are occurring.
If you’re a Pulsar client and you’d like to learn more on previews, we’re here for you: just contact us on [email protected]. New to Pulsar but curious to learn more? We’re here for you – drop us a line on [email protected]
Of course you’re always welcome to give us a good old fashioned phone call on +44 (0)20 7874 6577