Build a picture of your audience with these 7 tips & features on Pulsar
Imagine knowing exactly who your target audience is: what kind of music they're into, or which shops they buy clothes from. If you are selling products or services, most would agree that's pretty useful information. You can already do this, just with a little help from data: but where do you begin, and how do you know you're on the right track to valuable marketing insights?
By tracking and analysing data you will begin to see patterns in conversations, see when your target audience is active online, see who the main influencers are, and pin down the main hubs of chatter. With this insight, you can begin to explore your audiences' behaviours and build a picture of their demographical make up. By knowing who your audience is, and building this information into future marketing strategies, you can improve the relevance of your products and services.
To ensure analysing data is as simple as possible, we've listed seven features and tips you may not know you can do on Pulsar.
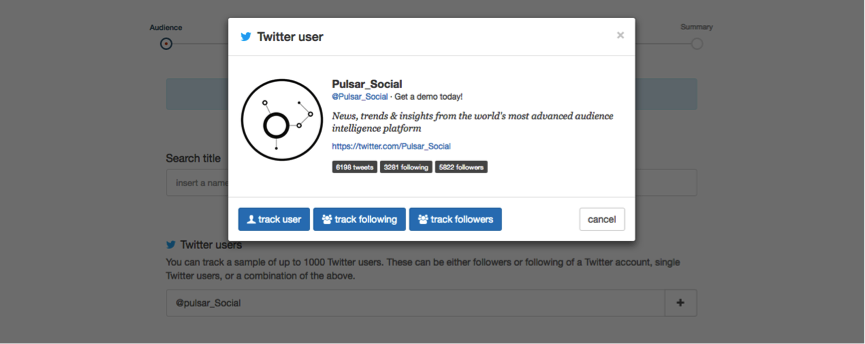
1) Follow the people that a user is following on Twitter
When tracking an audience on Pulsar, not only can you track a Twitter user or their followers (or both!), but you can also track the people that a particular user is following:
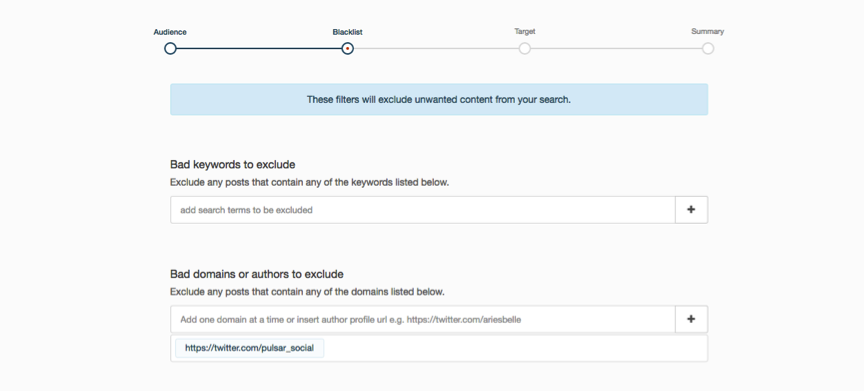
2) Blacklist an author
If you want to permanently remove users from appearing in your search results, you can block their conversations and, as a result, reduce the noise in your dataset. To do this just go to the Blacklist section in your search settings:
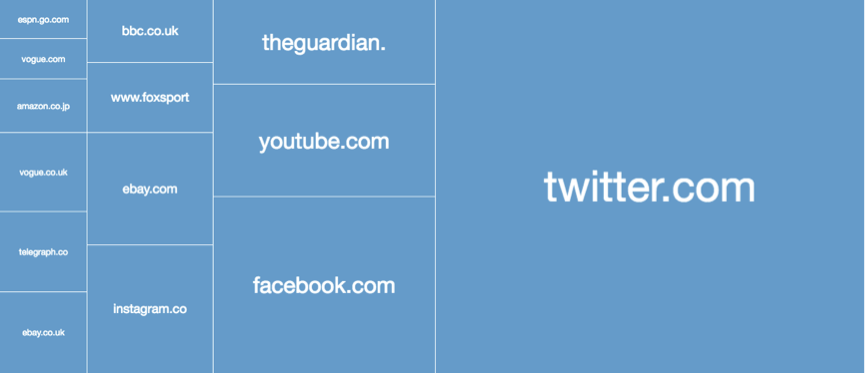
3) View the most shared websites within a conversation
When analysing top content, it’s not only important to understand what content is being shared but also the most popular websites the content is being shared from and how frequently. For example, if you were tracking all mentions of 'Pokemon Go' you could quickly see the number of websites posting about the mobile game and which websites are receiving the most traction:
4) Understand who your influencers are
Do Beliebers love Weetabix? If so, who are the main drivers of the conversation? The influencer network graph allows us to identify celebrity fans affiliated to brands, as well as visualise who in your audience is central to spreading a certain topic, idea or piece of content.
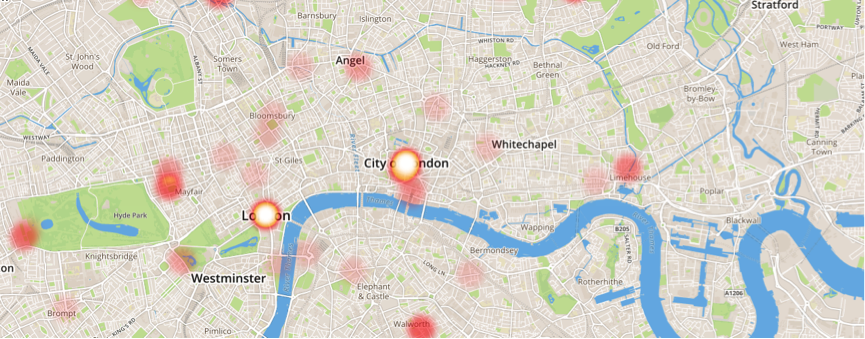
5) Filter and cluster at city level
Use geolocated data to get a better insight into your conversations. You can dive into the data at city level by exploring our coordinates graph. Last year we used this feature to see whether there was any correlation between people talking about, and drinking from, rooftop bars when London was in the midst of a heatwave:
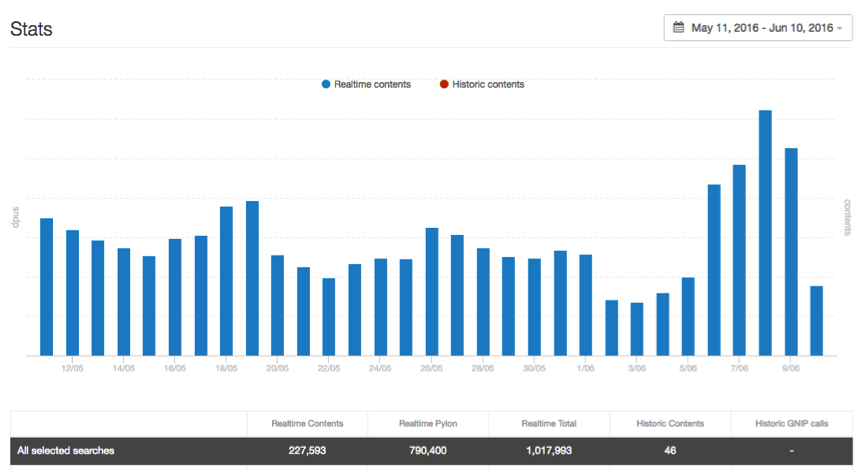
6) Stats page
You can keep track of how close you are to hitting your monthly data allowance by heading to the stats page. This area of the dashboard gives you a better breakdown of your searches, visualising which search is taking up all of your data:
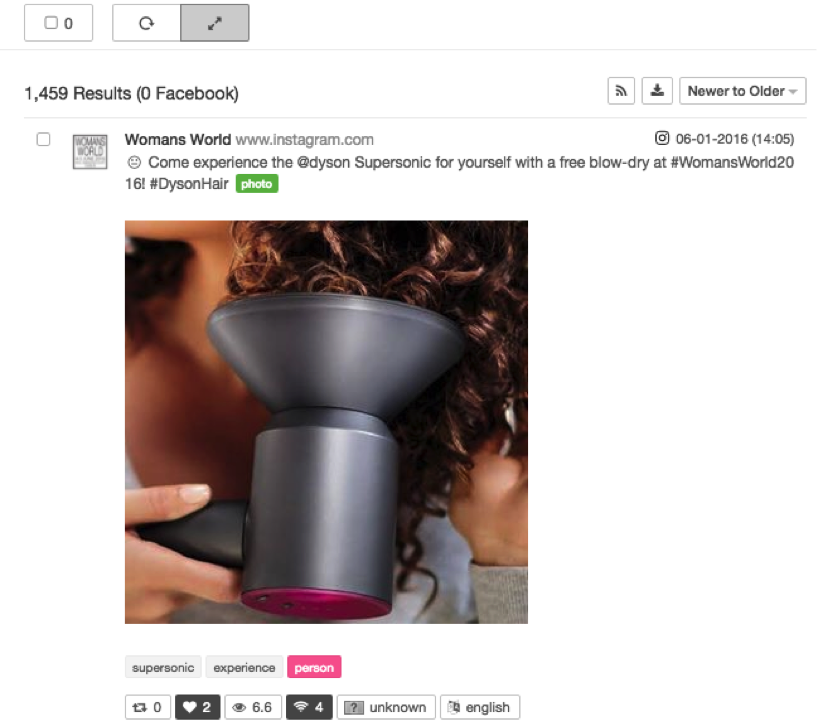
7) Easily expand your content
To see an attached link, video or image in a piece content is key to your data analysis, and there is nothing worse then having to click into a piece of content to expand it . On Pulsar, you can actually expand all of your content when you are in your search results view by clicking on the top left arrows, highlighted below:
If you're not working in Pulsar, you can now email our Support Team offline as well: [email protected].
If you’re already using Pulsar and want to learn more about these hidden areas of the platform, please contact your account manager or email: [email protected].
Alternatively, if you’re yet to experience the power of Pulsar and you’d like to set up a demo, email [email protected] or call us on 020 7874 6577.