Pulsar top 10 innovations of 2015: how we’re changing the game in the social listening industry
A lot can happen in 12 months. A lot more happens if you work at Pulsar!
Here's our top 10 product innovations of 2015, enjoy the memories ;)
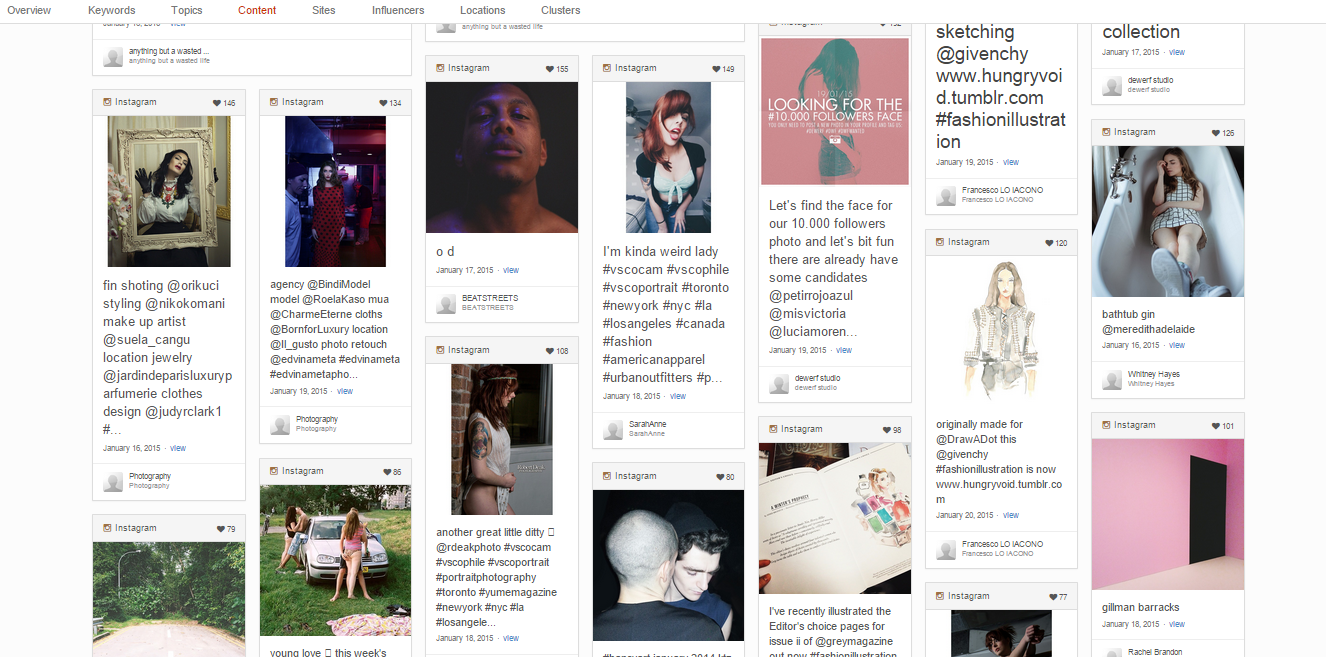
Instagram: mine the visual web on Pulsar
Explore the platform's potential for brands in this review of Facebook's research study here.
Content Dashboard: all the best bits in one place
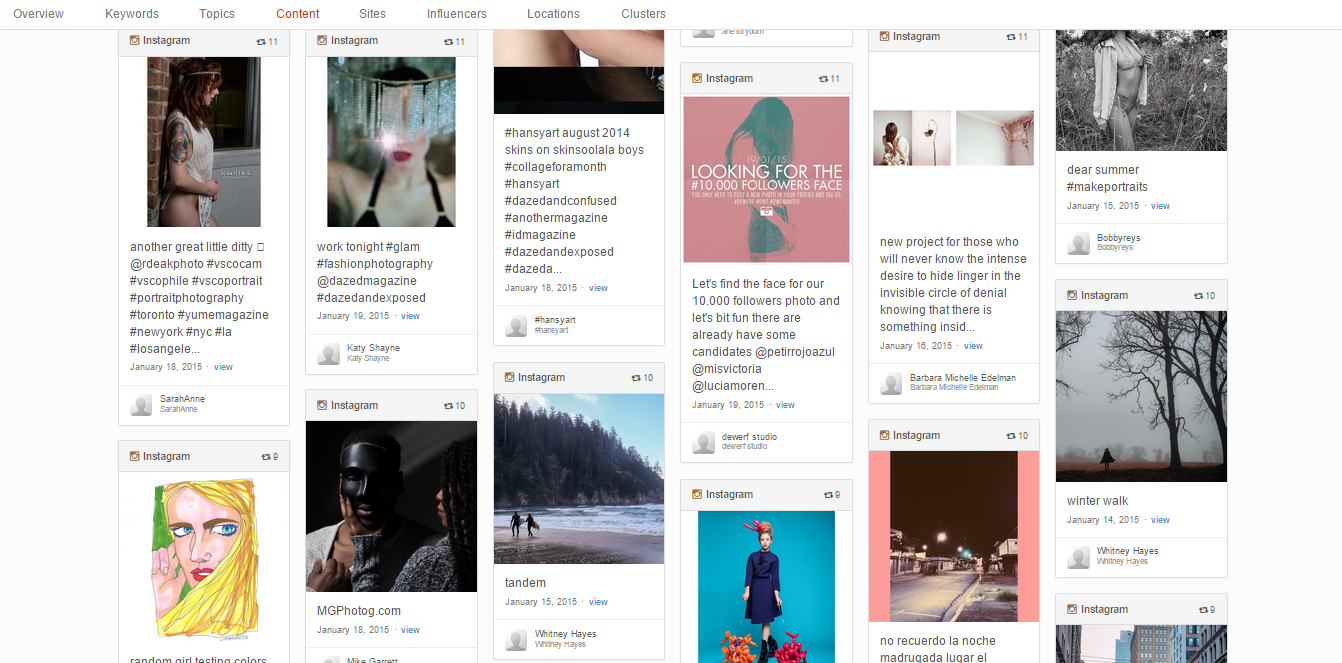
It’s called Content, the new section of the platform showing you all the “best bits” of your search in one place. We display it so that the images themselves are front and centre of the visualisation, and you can see what’s most popular at a glance.
Check out the power of Content and image analysis in the full blog post here.
Media Queries for focussed datasets
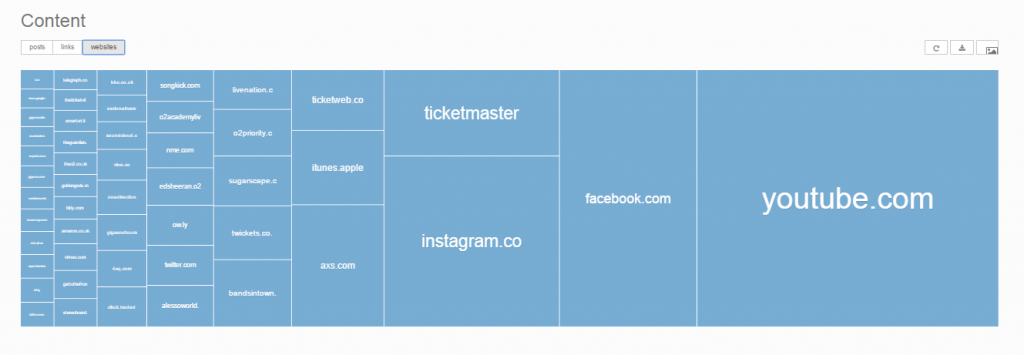
We know Pulsar customers want to bring back all the data that’s relevant to their needs and want to be able to analyse it by media type. That’s why we released two new options for more focused social data, image-only searches and hyperlink-only searches.
For all of the details on media specific queries, check the blog here.
Pulsar Core: own channel analytics done right
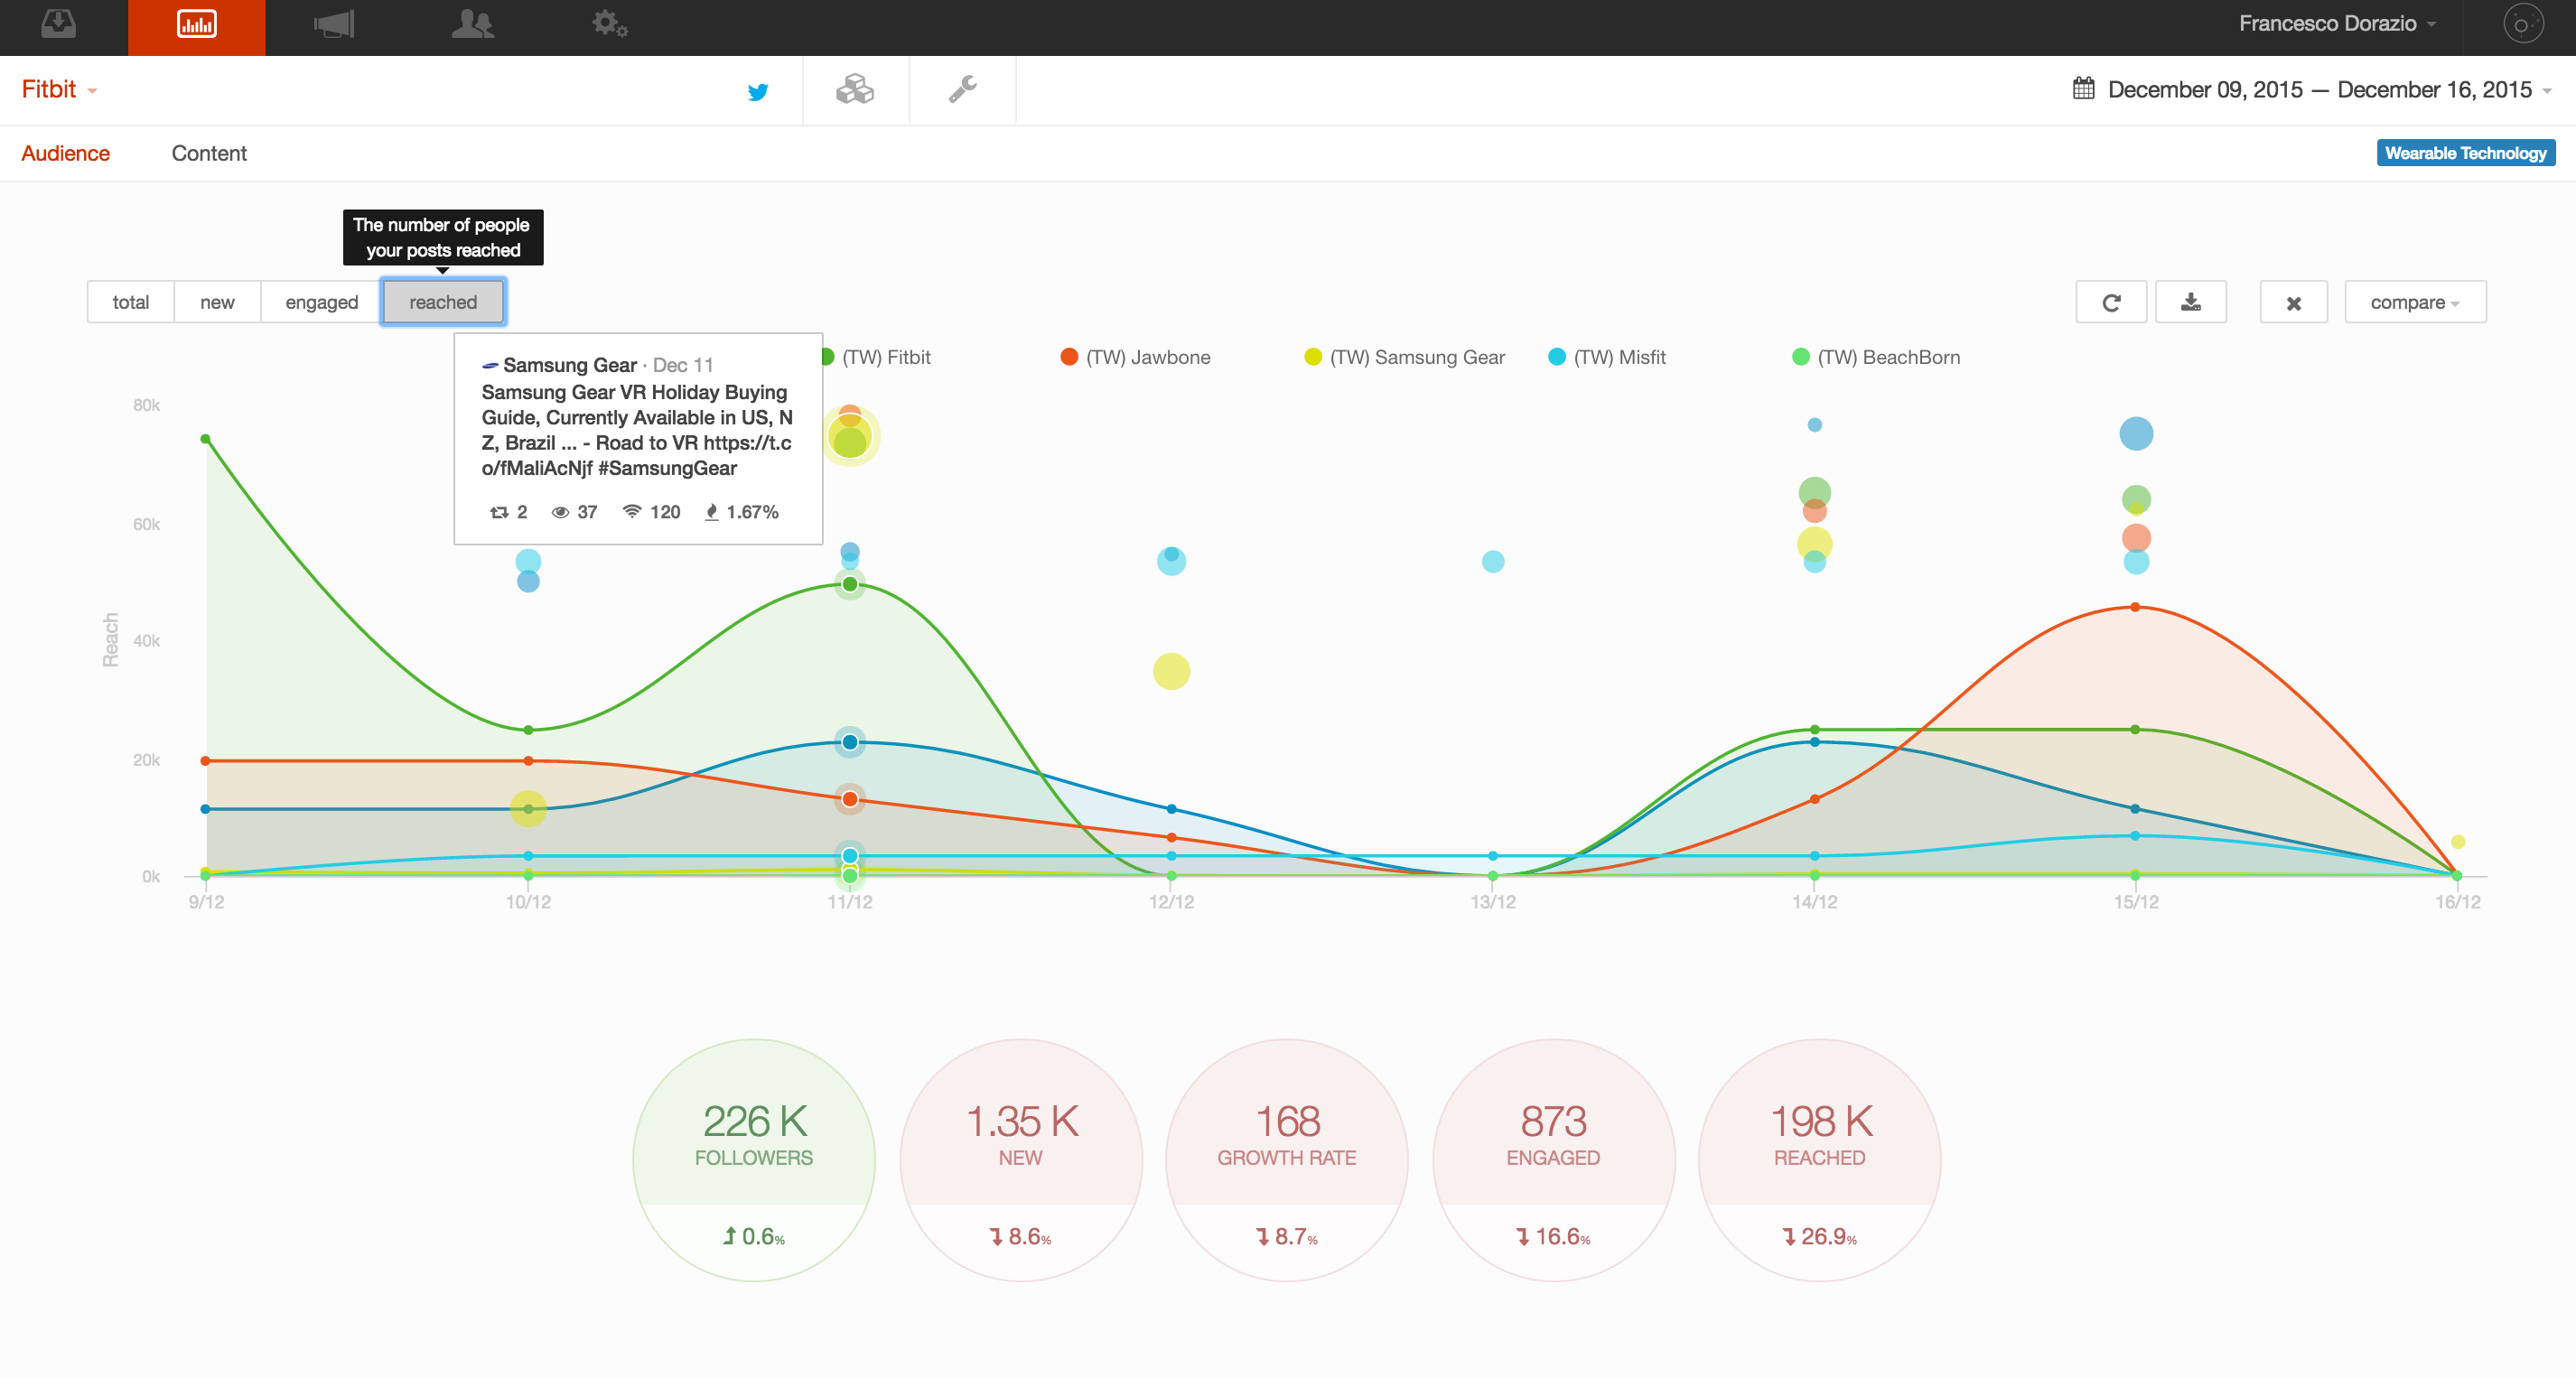 We introduced a whole new product to the Pulsar suite with a big one! Pulsar CORE measures the reach, awareness and engagement brands are generating through their own social channels and combines it with the activity the brand is generating elsewhere in social media to provide a holistic picture of the social audience.
CORE evaluates both owned and earned media using comparable metrics and boils them down to one simple Social Brand Score for understanding your brand performance online and against your competitors.
Own channel analytics is a huge addition to Pulsar, discover the finer details about this new product here.
Facebook Topic Data: a game changer for the social media industry
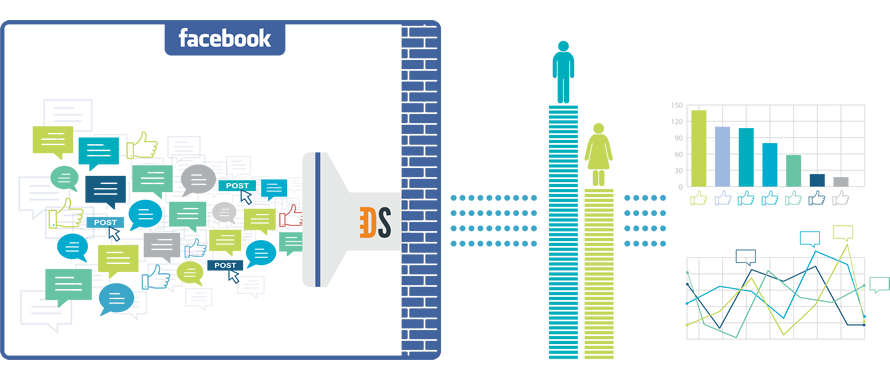
In June 2015 Pulsar was the first platform to provide access to Facebook Topic Data. Since then we’ve been working directly with Facebook and 70% of our customers to show how powerful this data can be.
The release of anonymised and aggregated topic data was huge for the marketing industry - find out why here. Or explore the reasons topic data is essential for your data plan here.
Twitter Full Archive Search: Instant access to every single tweet ever created
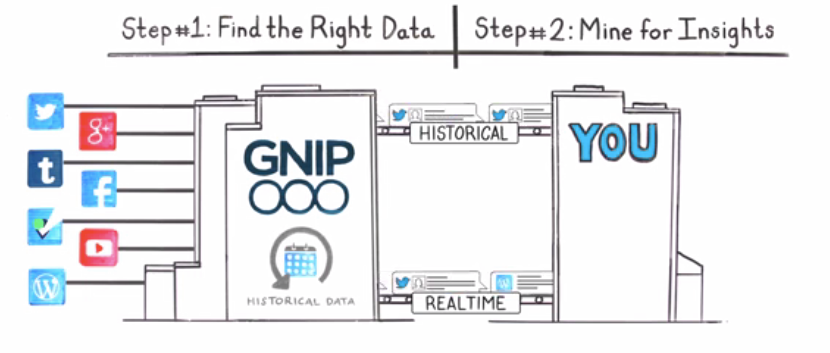
In August we started to offer instant access to nine years’ worth of Twitter. Since then, the Full-Archive Search API has allowed our users to instantly search for any tweet ever produced, back to the very first one in 2006.
See what this meant for Pulsar's historical data capabilities in our blog post.
Audience Demographics Dashboard: know thyself
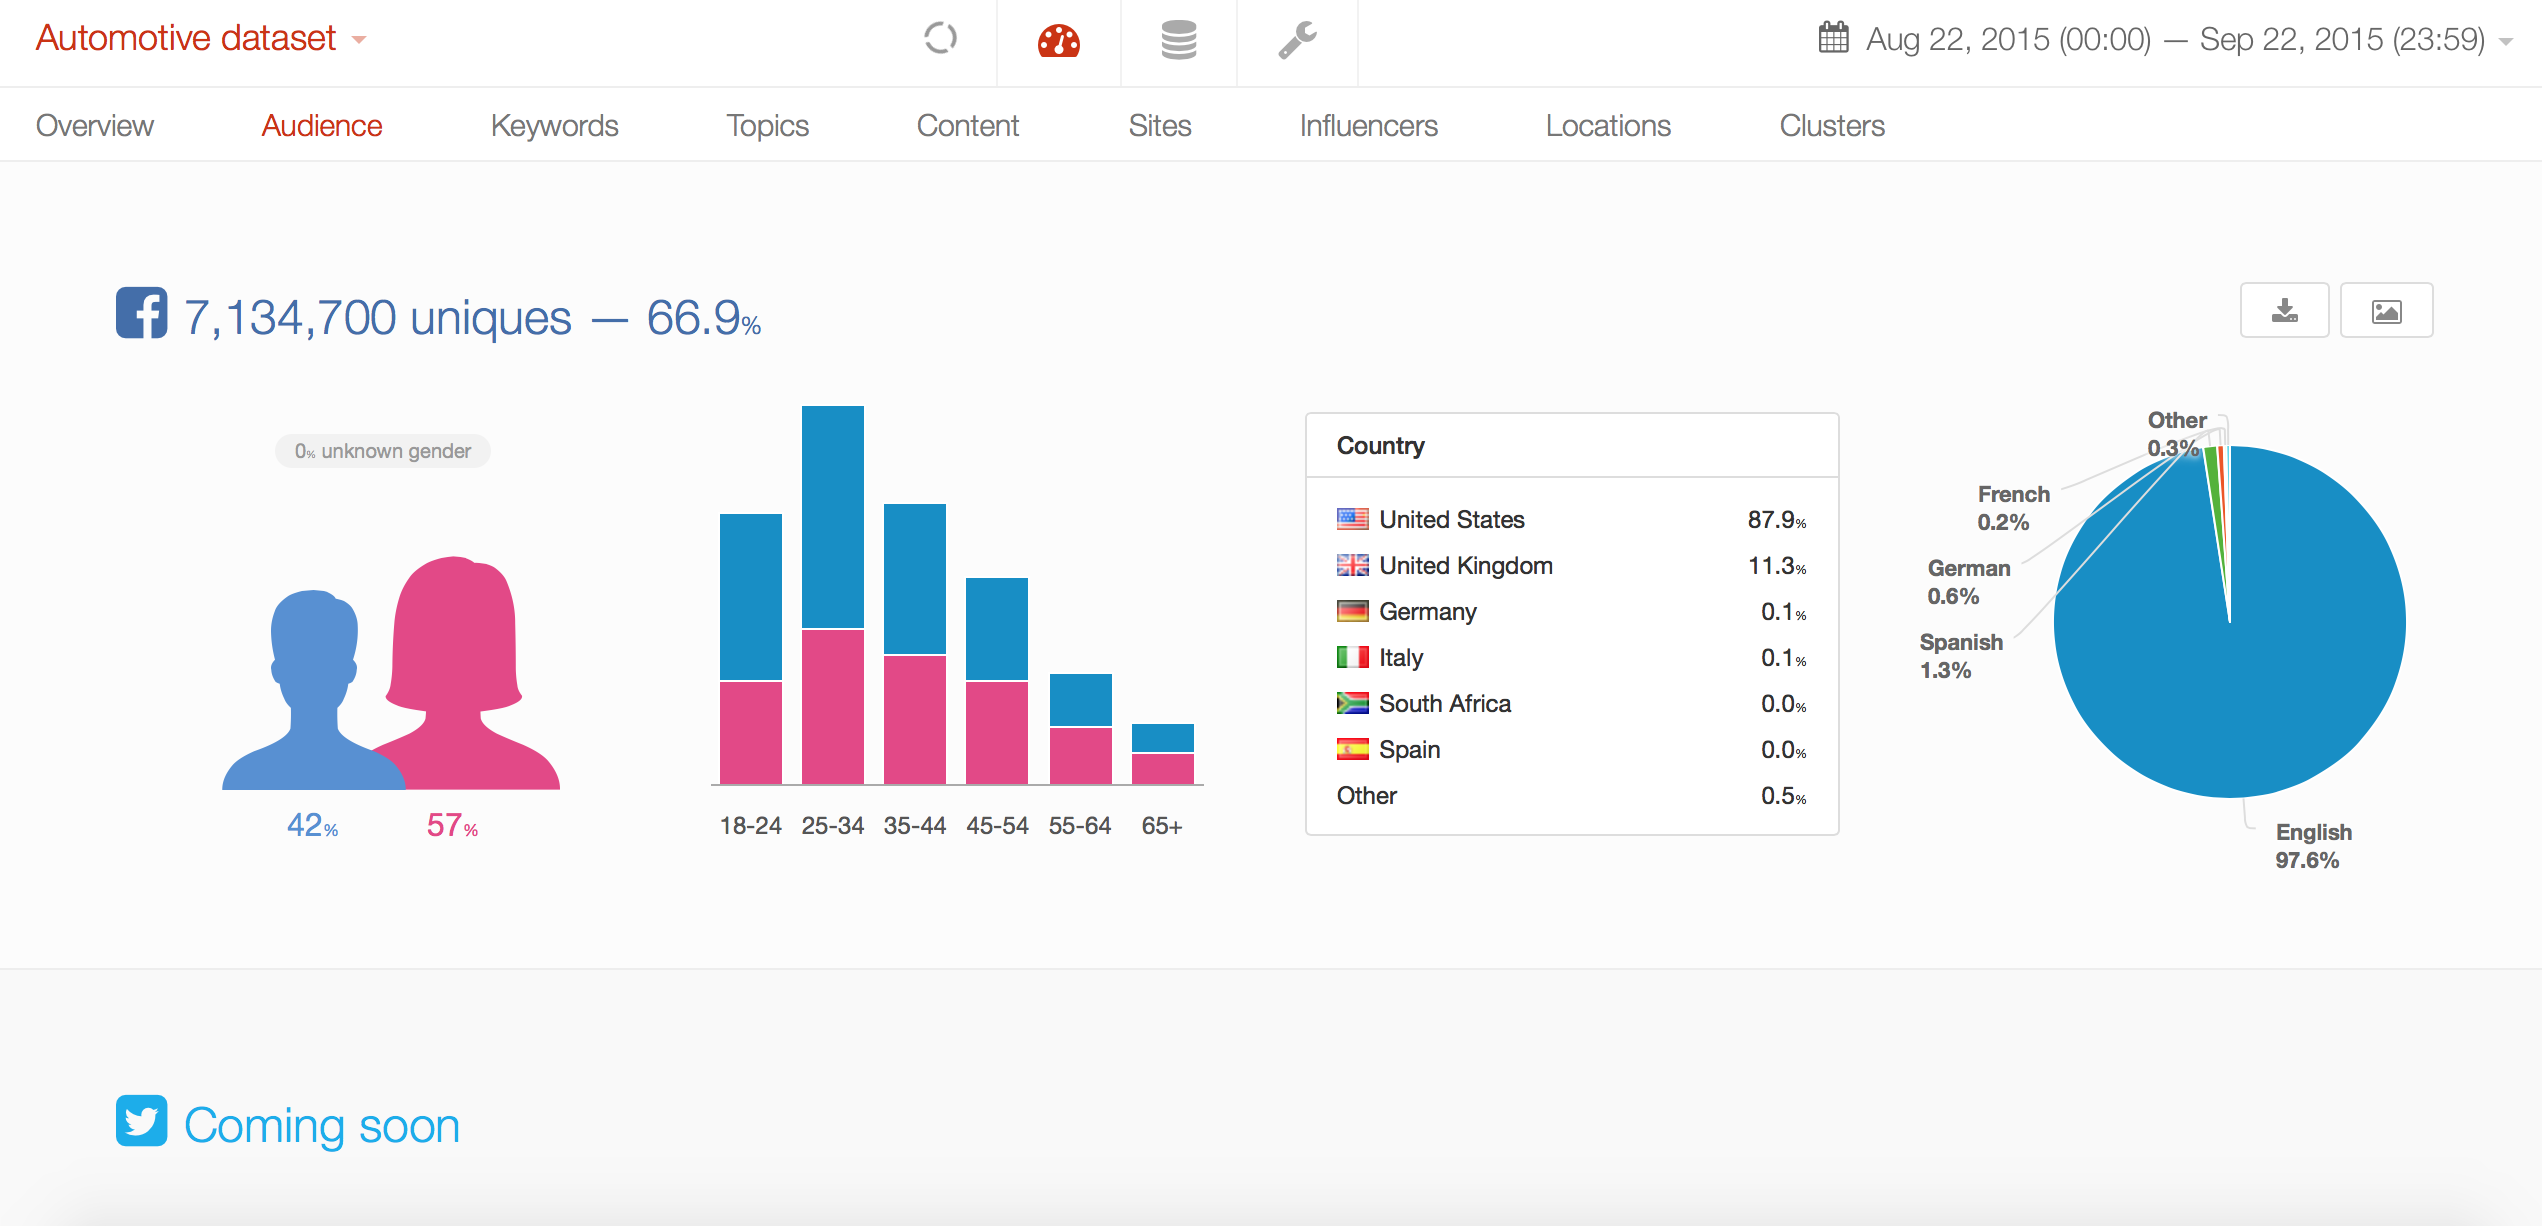
Alongside Topics, Keywords, Clusters, Influencers, Content and Location, this new dashboard presents audience demographics in straight to the point, bite-sized visualisations providing a holistic view of the data.
Discover the full breakdown of what Audience can do to your data analysis here.
Interactive Graph Visualisation in the browser: easy network analysis for all
Network analysis has always been a key element of the way Pulsar looks at social data. Last year we released the first integration with Gephi that gives our users the ability to plug their social data directly into Gephi. This year we released a new interactive graph visualisation that shows the core of any network right in the browser to help the researcher make sense of information flows and audience behaviour before they go onto working on a full network analysis of the dataset.
Historic Previews by Day: get an instant sneak peak into your dataset
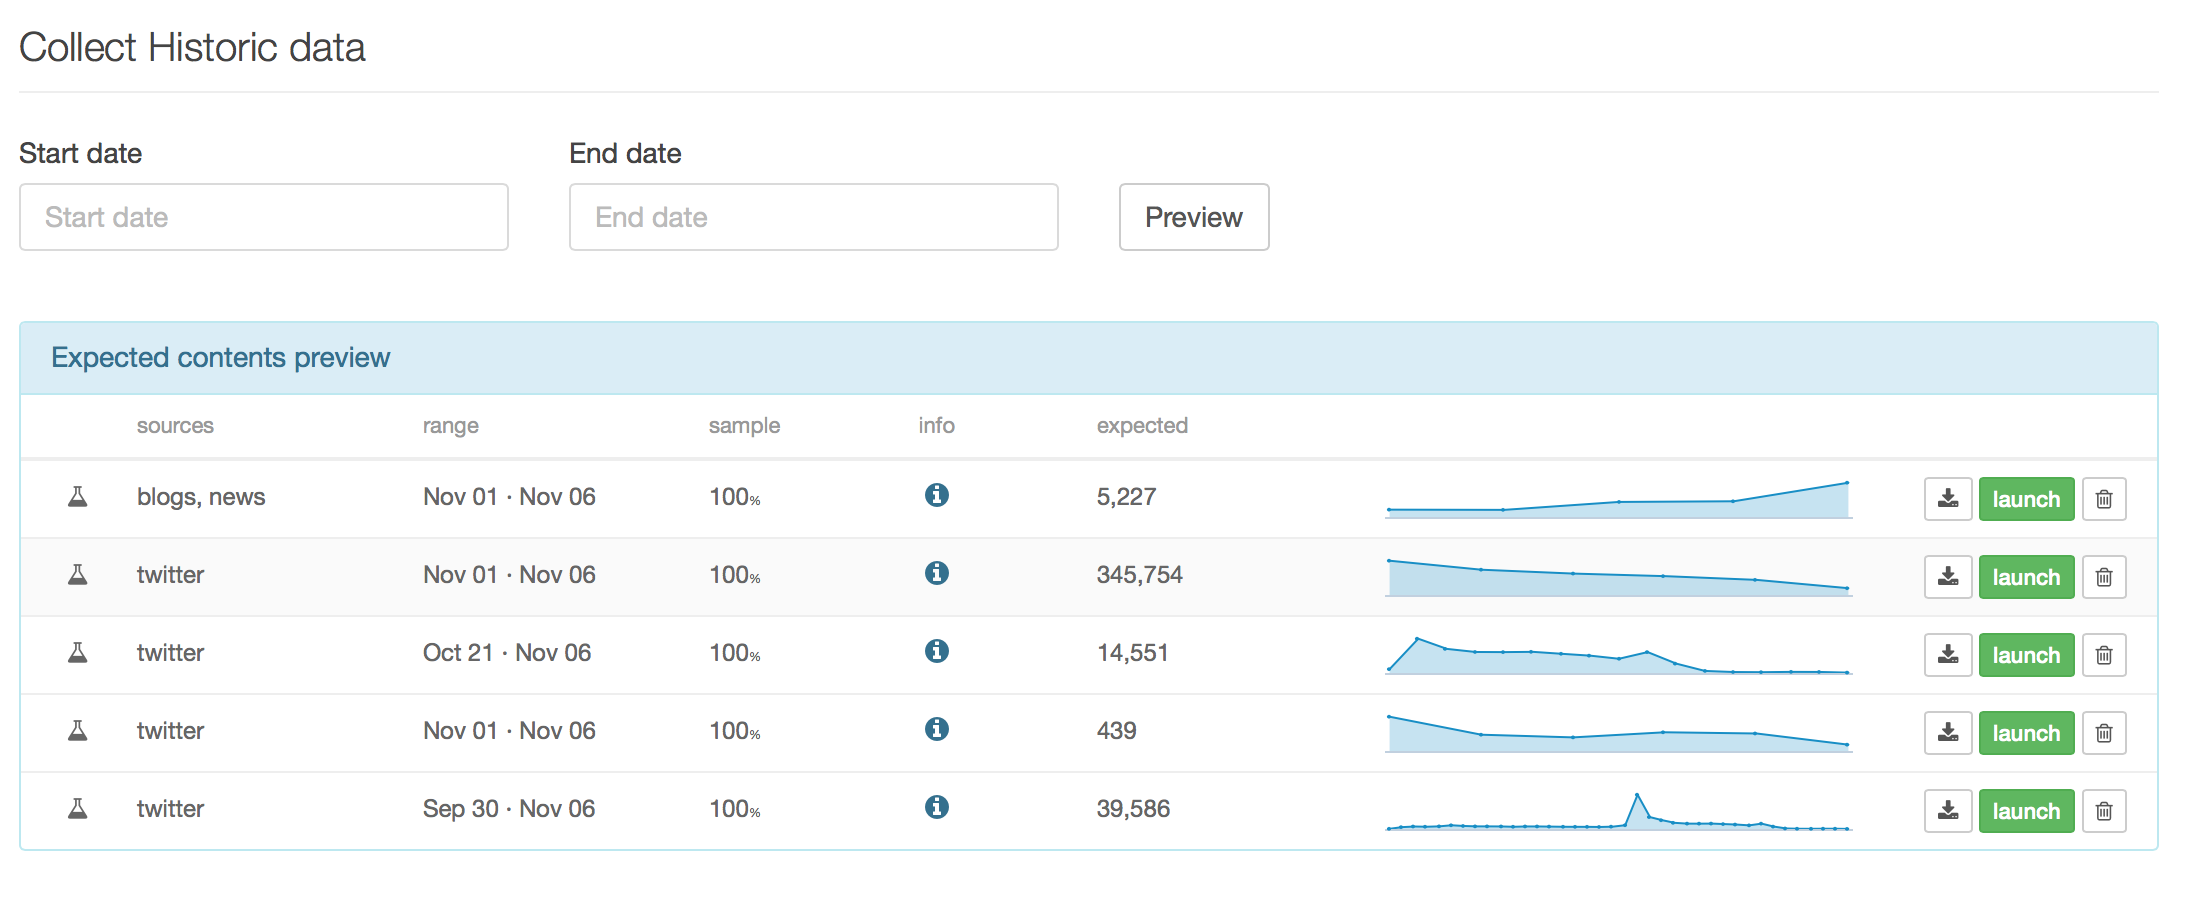
Previewing historics got smarter and easier when we launched a new historics preview functionality which allows users to see a daily breakdown of their historic dataset before the data has actually been collected. This opens up a whole range of new research, planning and advertising use cases and we're really excited to see how our users are already leveraging this functionality.
Understand how this innovation can enhance Pulsar's user experience by reading the detailed blog post here.
Clusters 2.0: the most versatile custom charting solution in the social listening space
Pulsar already provides a huge variation of ways users can visualise their data, but clusters are popular because they allow you to visualise your data in a different, more customised way. Clients are using clusters in a number of different and creative ways, but we keep seeing three use cases that are most prominent: reporting, real-time updates and data segmentation. New visualisations, sizing, drag and drop, colour editing, data preview
Check out the biggest update to Clusters since their launch here.
New Filter Panel: next level data segmentation
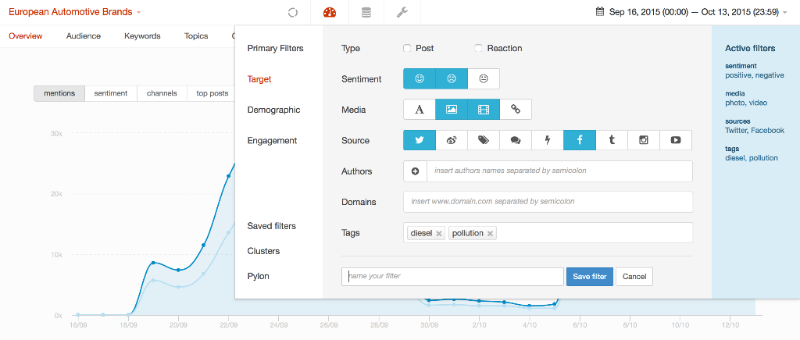
A smarter and simpler user experience to support advanced, faster data segmentation. See how this next level data segmentation can aid your analysis here.
Pulsar Vision: image analysis on the fly
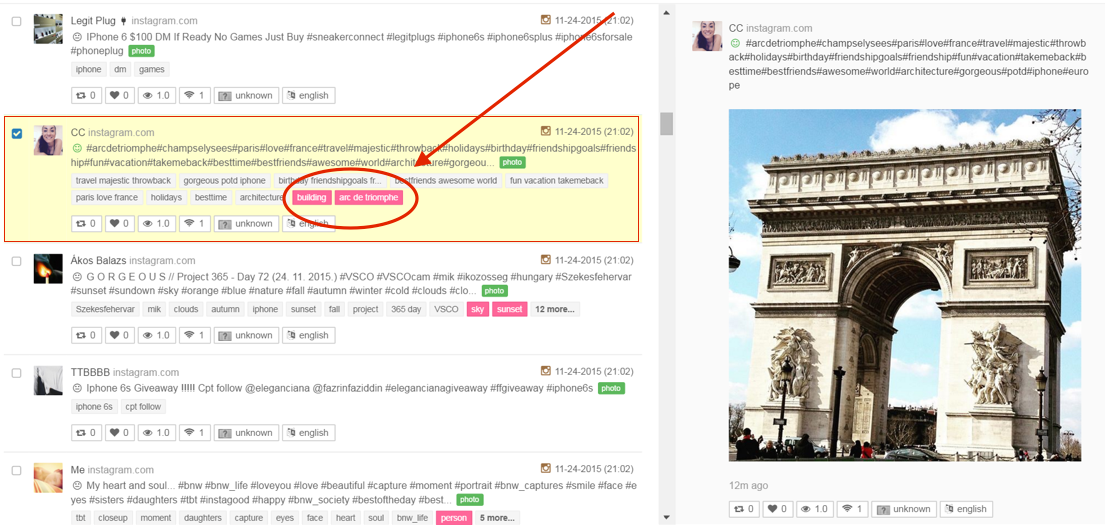
Understanding images is now key to understand the social conversation. That’s why we launched a suite of deep learning tools to help our users make sense of the visual side of social media. Simply put, Pulsar now helps you understand the content and the context of a picture by analysing the picture itself rather than just the caption that comes with it. Image analysis is so powerful that Instagram decided to showcase it at their last Auto event where they shared Pulsar analysis of the images most associated with the top car brands in Europe.
Discover the full capabilities of one of the most intelligent image analysis tools on the market here.
So this was the best of our 2015. And we can't wait to share our plans for 2016!
If you’re looking to implement social media listening into your 2016 marketing strategy, make sure you set up a demo with Pulsar by emailing [email protected] or call us on 020 7874 6577.